- Technical Analyses for Bitcoin and 50+ altcoins
- Simple and consistent
- Traders can use Technical analyses to learn application of the basic principles of TA or as building blocks for their trading strategies

Quality Content
Technical analyses (trade setups) from altFINS experts
Higher Engagement
Increase trading volume and customer retention
Differentiation
Differentiate your service from competitors
Grow Revenue
Technical Analysis
consists of
Trade Setup: Provide trade entry and exit strategies, identifying key trends and trading opportunities
Trend: altFINS uses a proprietary trend scoring system to assess the trend direction and strength
Momentum: using MACD crossovers and RSI indicator, we determine bullish or bearish momentum
Patterns: we detect 26 price pattern types such as triangles, wedges and channels
Support and Resistance: we establish clear horizontal support and resistance zones, which become key trading levels (Buy Support, Sell Resistance)
Examples of use:
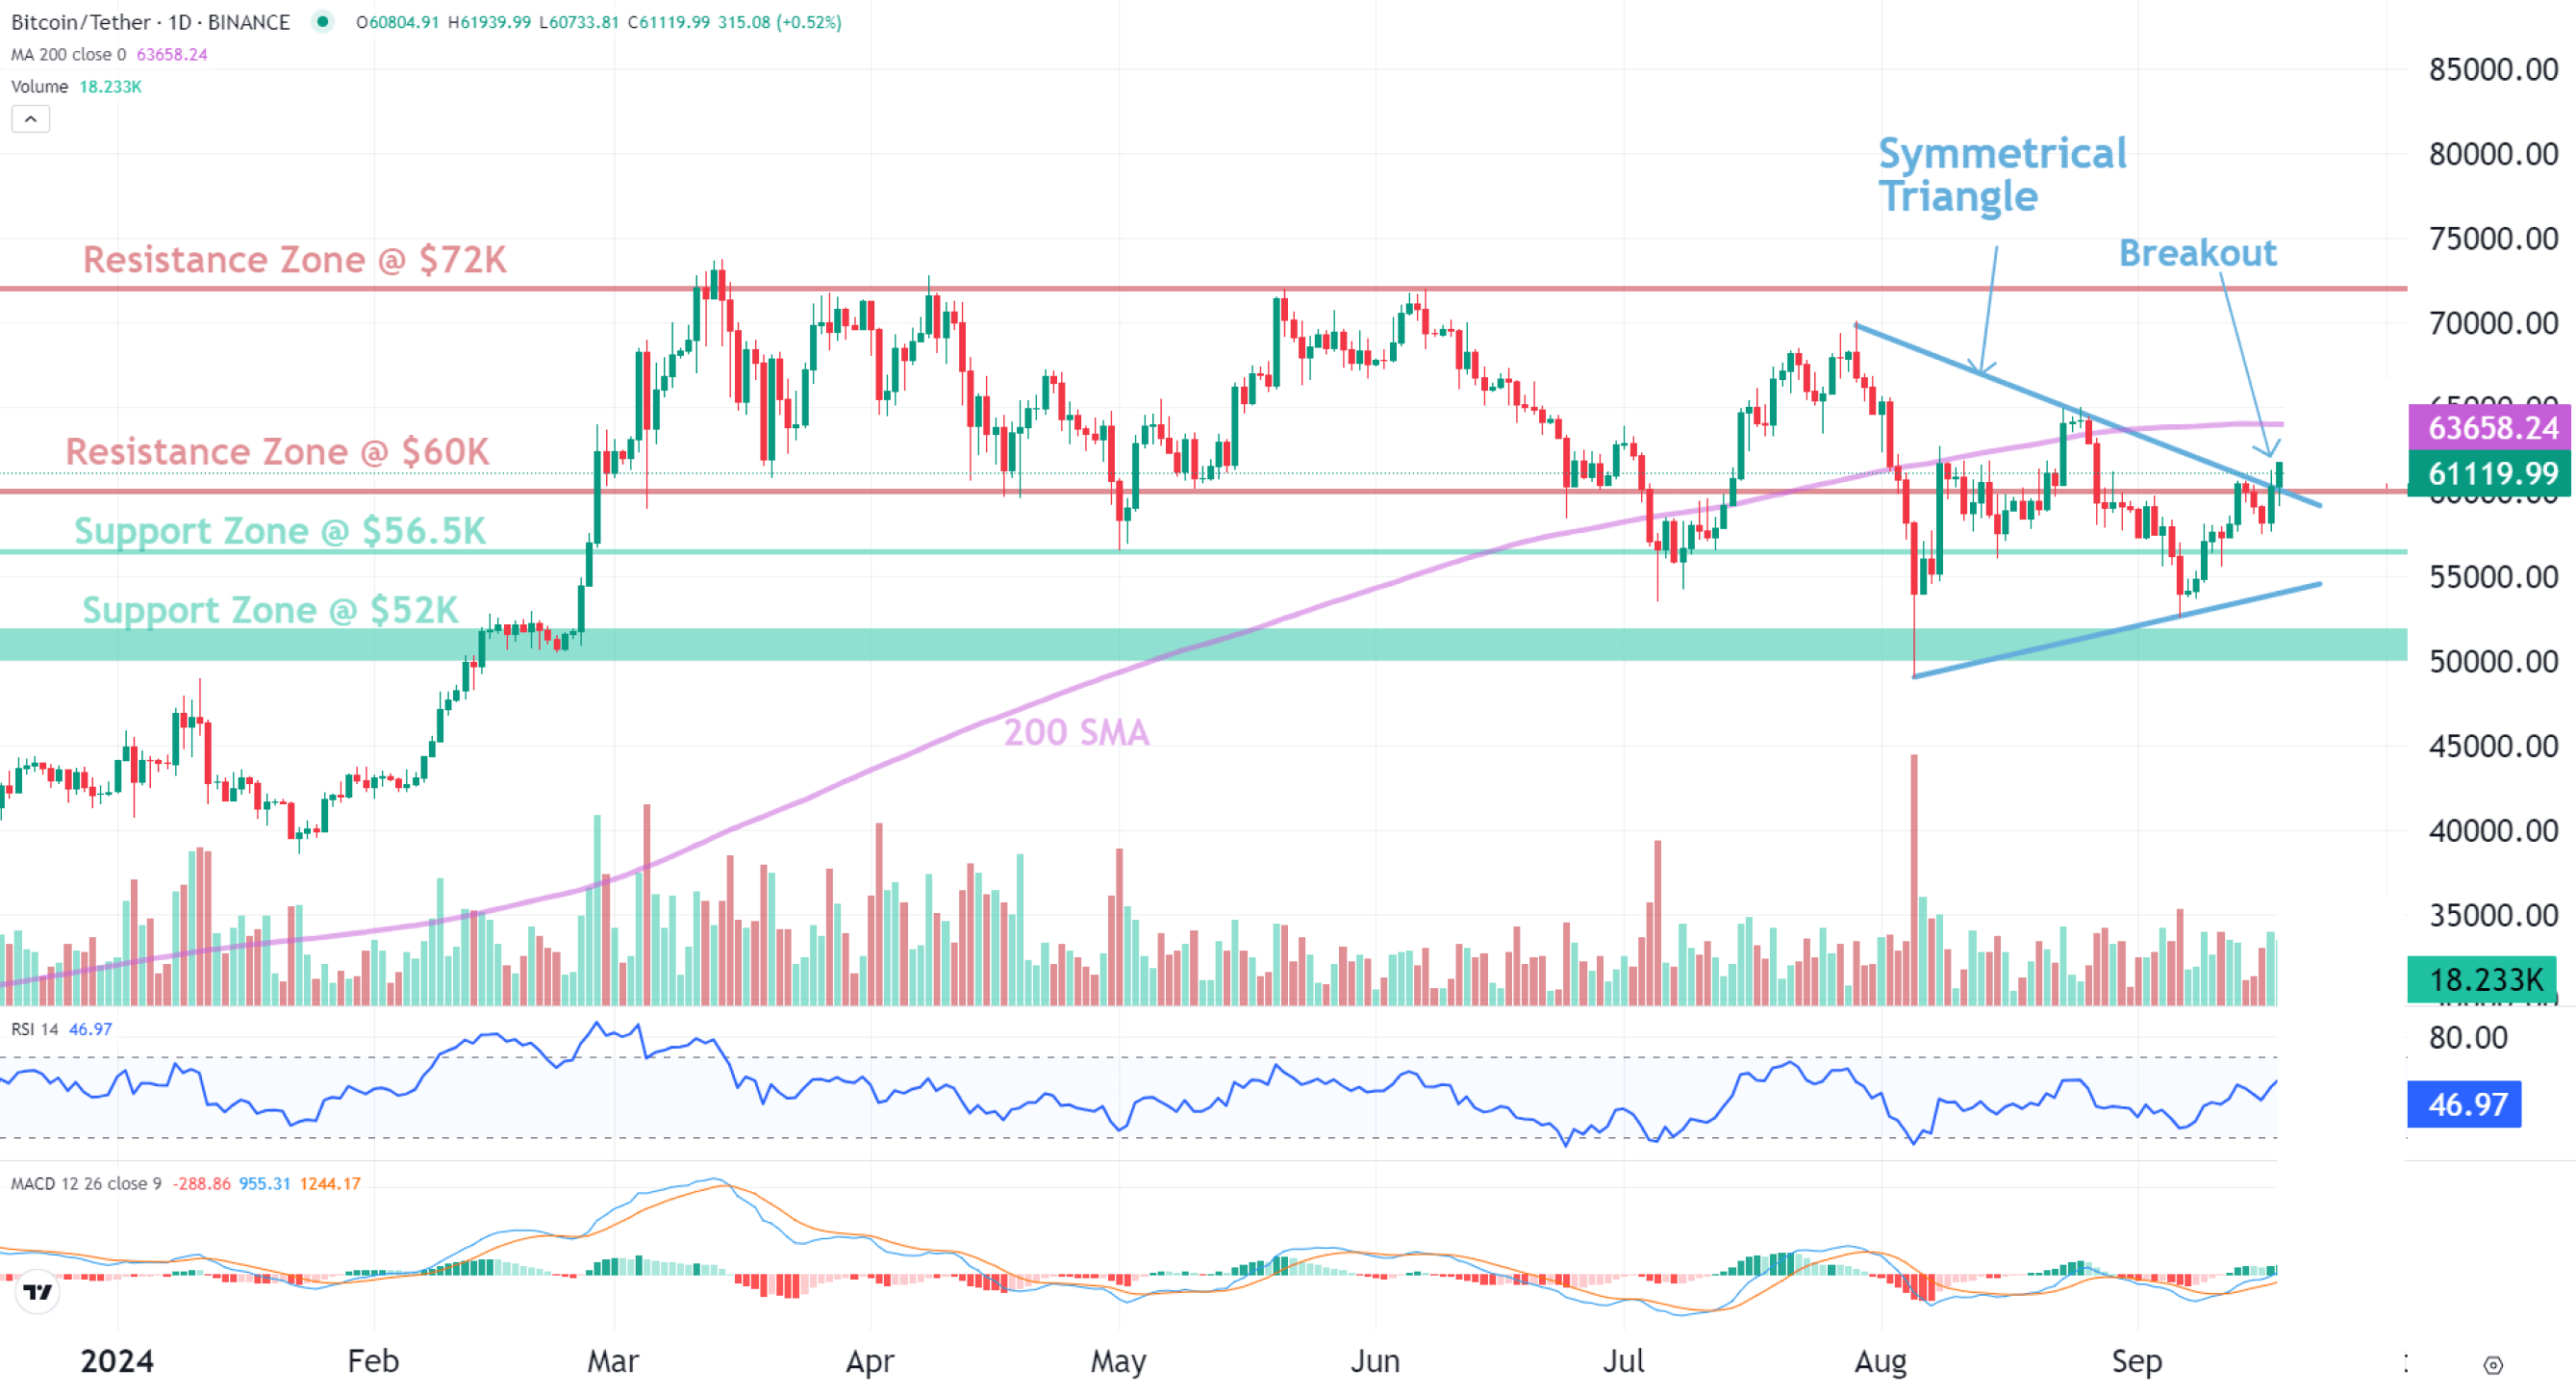
Example: Bitcoin Trade Setup
Trade setup: Trends are mixed but improving. It’s broken above $60K resistance and out of Symmetrical Triangle pattern and could revisit $72K. There’s a minor resistance at the 200-day moving average (~$63.4K). Stop Loss at $57K.
Pattern: Symmetrical Triangle, which is a neutral pattern, suggesting indecision in the market. Although it could break either up or down, it usually breaks in the direction of the prevailing trend (i.e. continuation not reversal).
Trend: Short-term trend is Neutral, Medium-term trend is Strong Up, Long-term trend is Strong Down.
Momentum: Price is neither overbought nor oversold currently, based on RSI-14 levels (RSI > 30 and RSI < 70). Support and Resistance: Nearest Support Zone is $56.5K, then $50K. Nearest Resistance Zone is $72K.
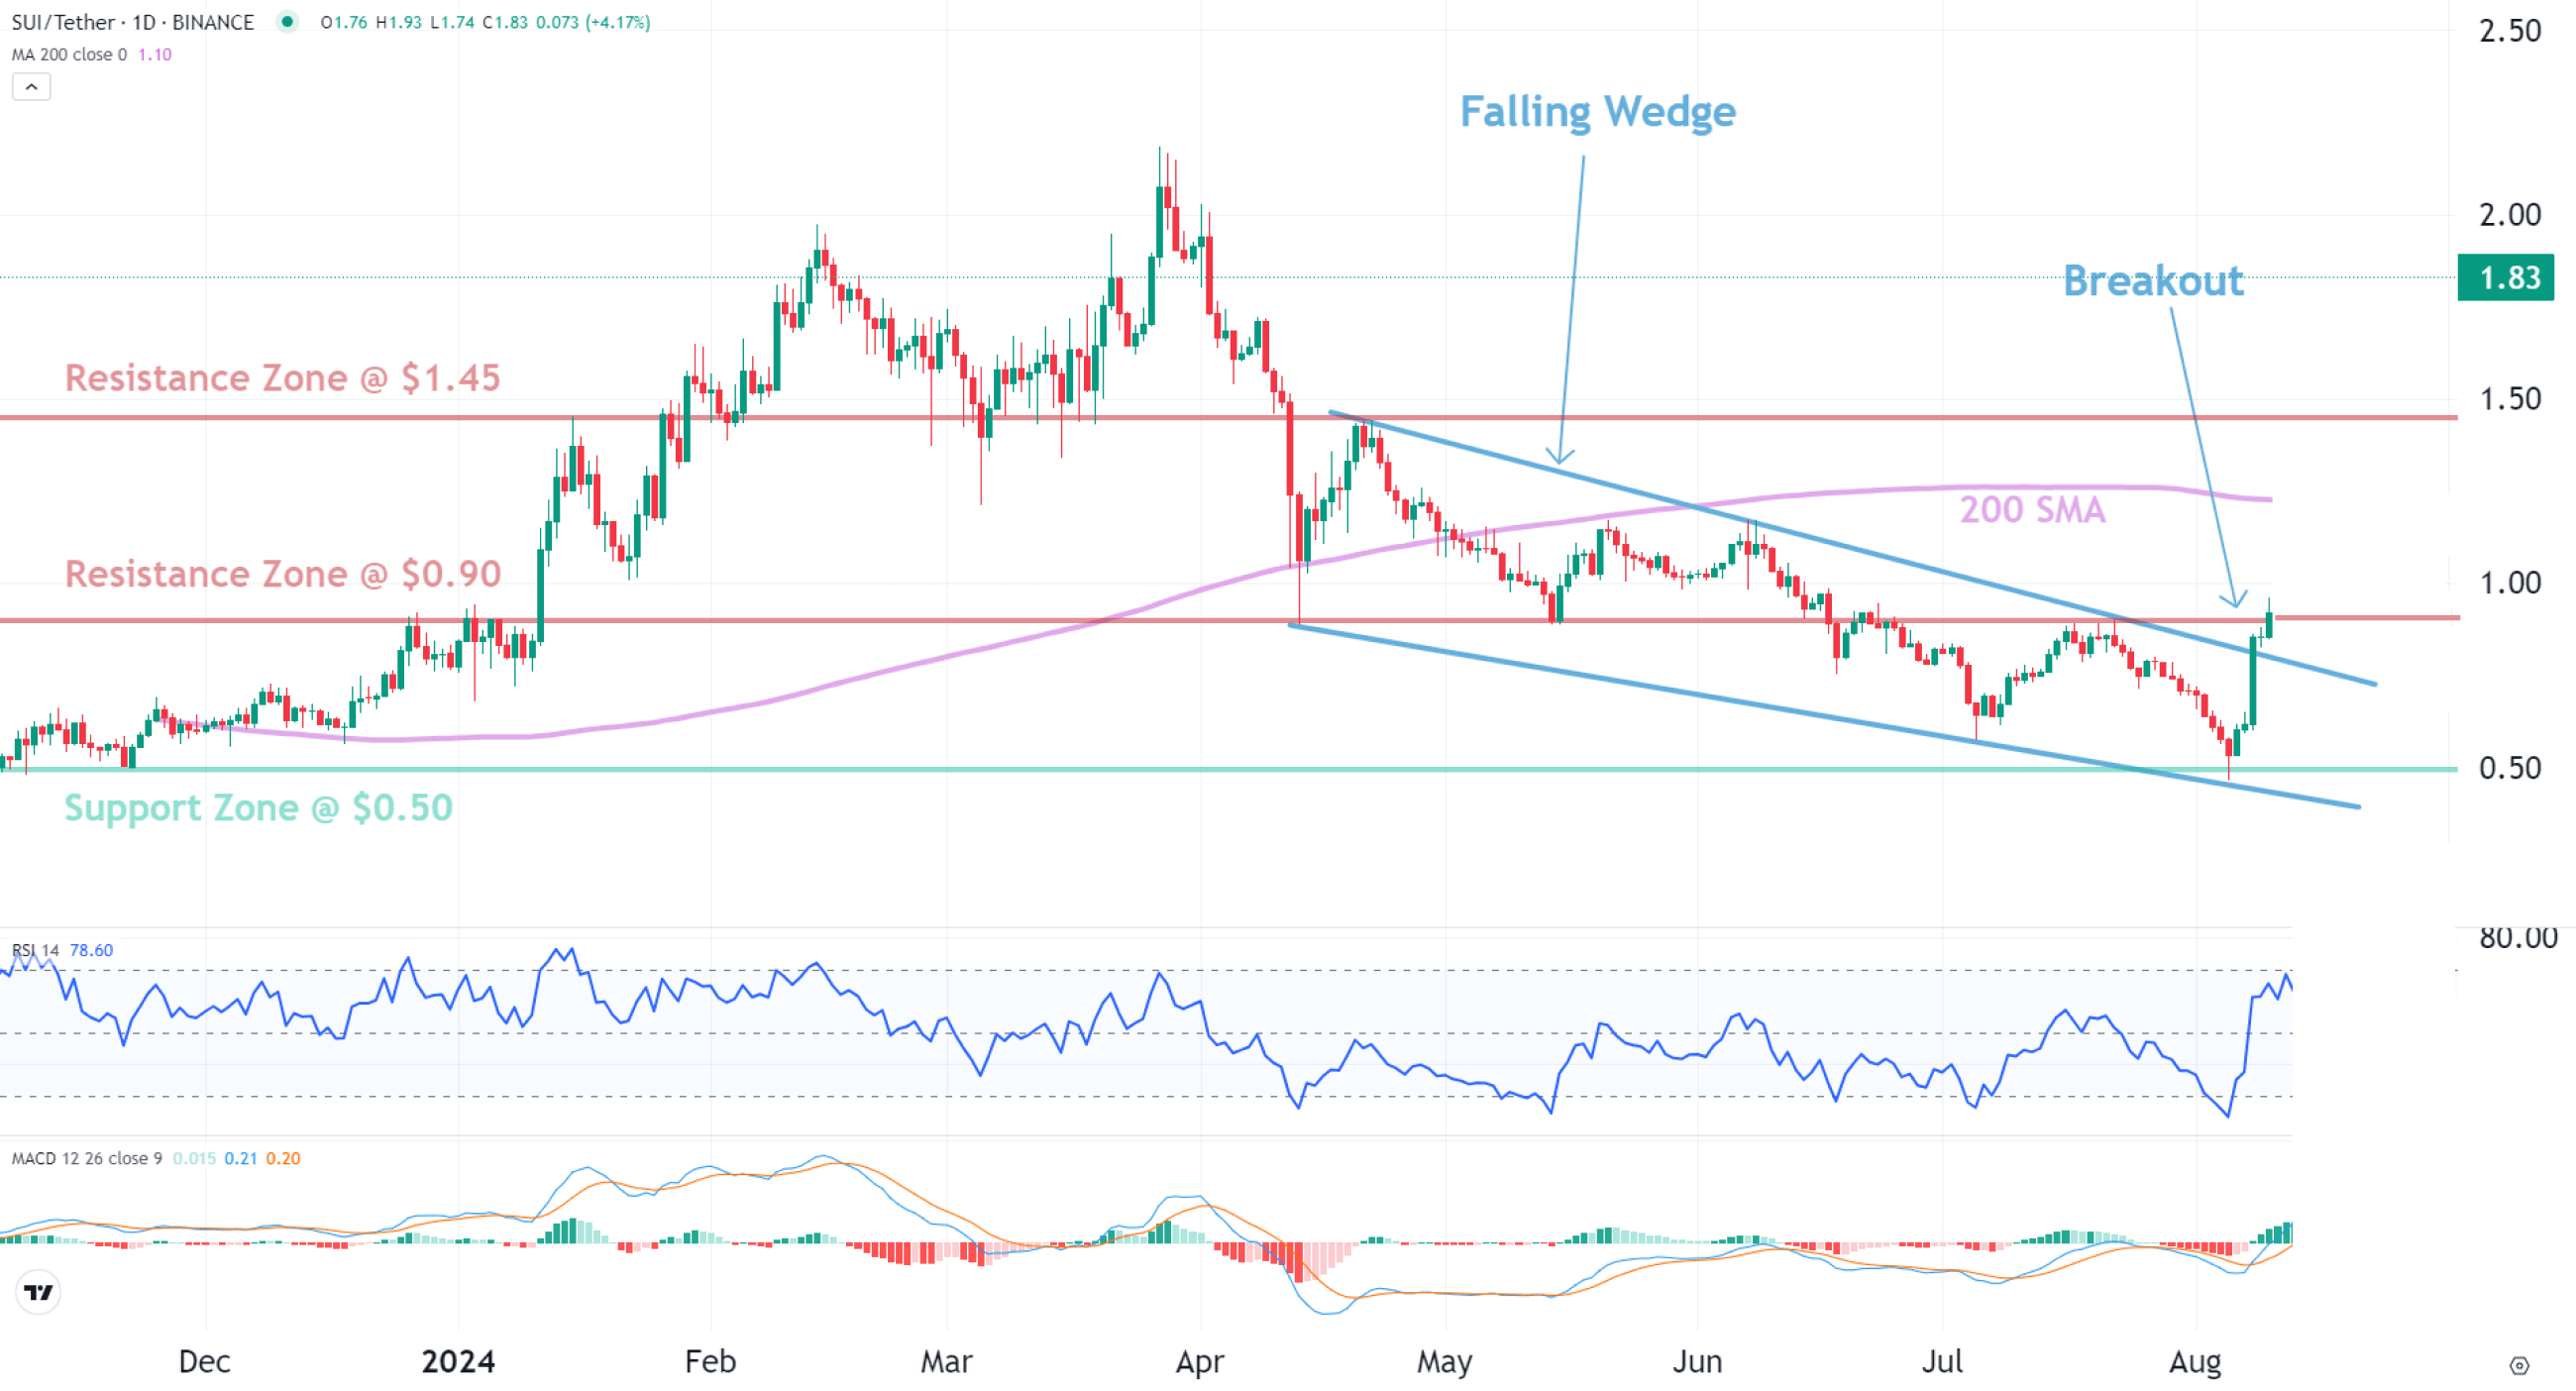
Example: SUI Trade Setup
Trade setup: Breakout from Falling Wedge pattern and above $0.90 resistance signals a bullish trend reversal with +25% potential upside to $1.15 resistance. Stop Loss at $0.73.
Patterns: Falling Wedge usually results in a bullish breakout. When price breaks the upper trend line the price is expected to trend higher. Emerging patterns (before a breakout occurs) can be traded by swing traders between the convergence lines; however, most traders should wait for a completed pattern with a breakout and then place a BUY order.
Trend: Short-term trend is Neutral, Medium-term trend is Down, Long-term trend is Strong Down.
Momentum: Price is neither overbought nor oversold currently, based on RSI-14 levels (RSI > 30 and RSI < 70). Support and Resistance: Nearest Support Zone is $0.50. Nearest Resistance Zone is $1.45.

