Oversold coins in Uptrend
In today’s video, we review recent market action and demonstrate a custom screener to find oversold coins in Uptrend.
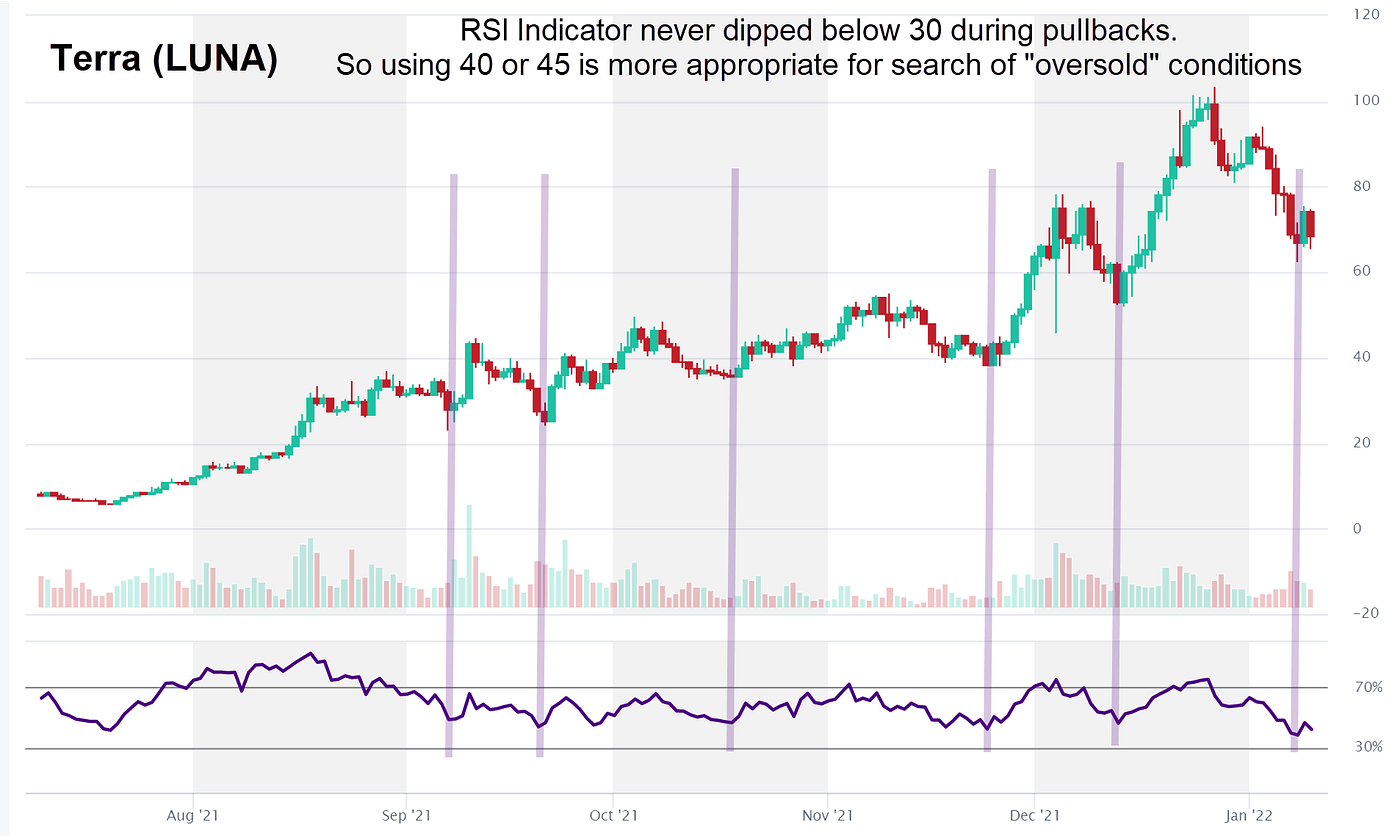
We use RSI indicator but instead of RSI under 30, we used RSI under 50. Why?
RSI Indicator is a range bound oscillator — it ranges from 0 to 100. Typically, RSI under 30 is oversold territory while RSI over 70 is overbought.
However, for coins in an uptrend, RSI rarely reaches 30 during pullbacks.
Take a look at LUNA chart below. During pullbacks, RSI barely reached 40!
So when looking for oversold coins in Uptrend, we must use a different value for RSI…40 or 45.

Invest into yourself with trading education!
Today’s curated charts summary:

