🚨 Crypto Pullback Alert: Is This Your Golden Entry Opportunity? 🚨
Attention, crypto traders! A popular asset that recently hit a new All-Time High (ATH) of $1,700 is now experiencing a significant pullback, signaling a potential dip-buying opportunity for those playing the long game. Don't just watch the charts; understand what's happening and how you can prepare!
The ATH Rejection: What Happened?
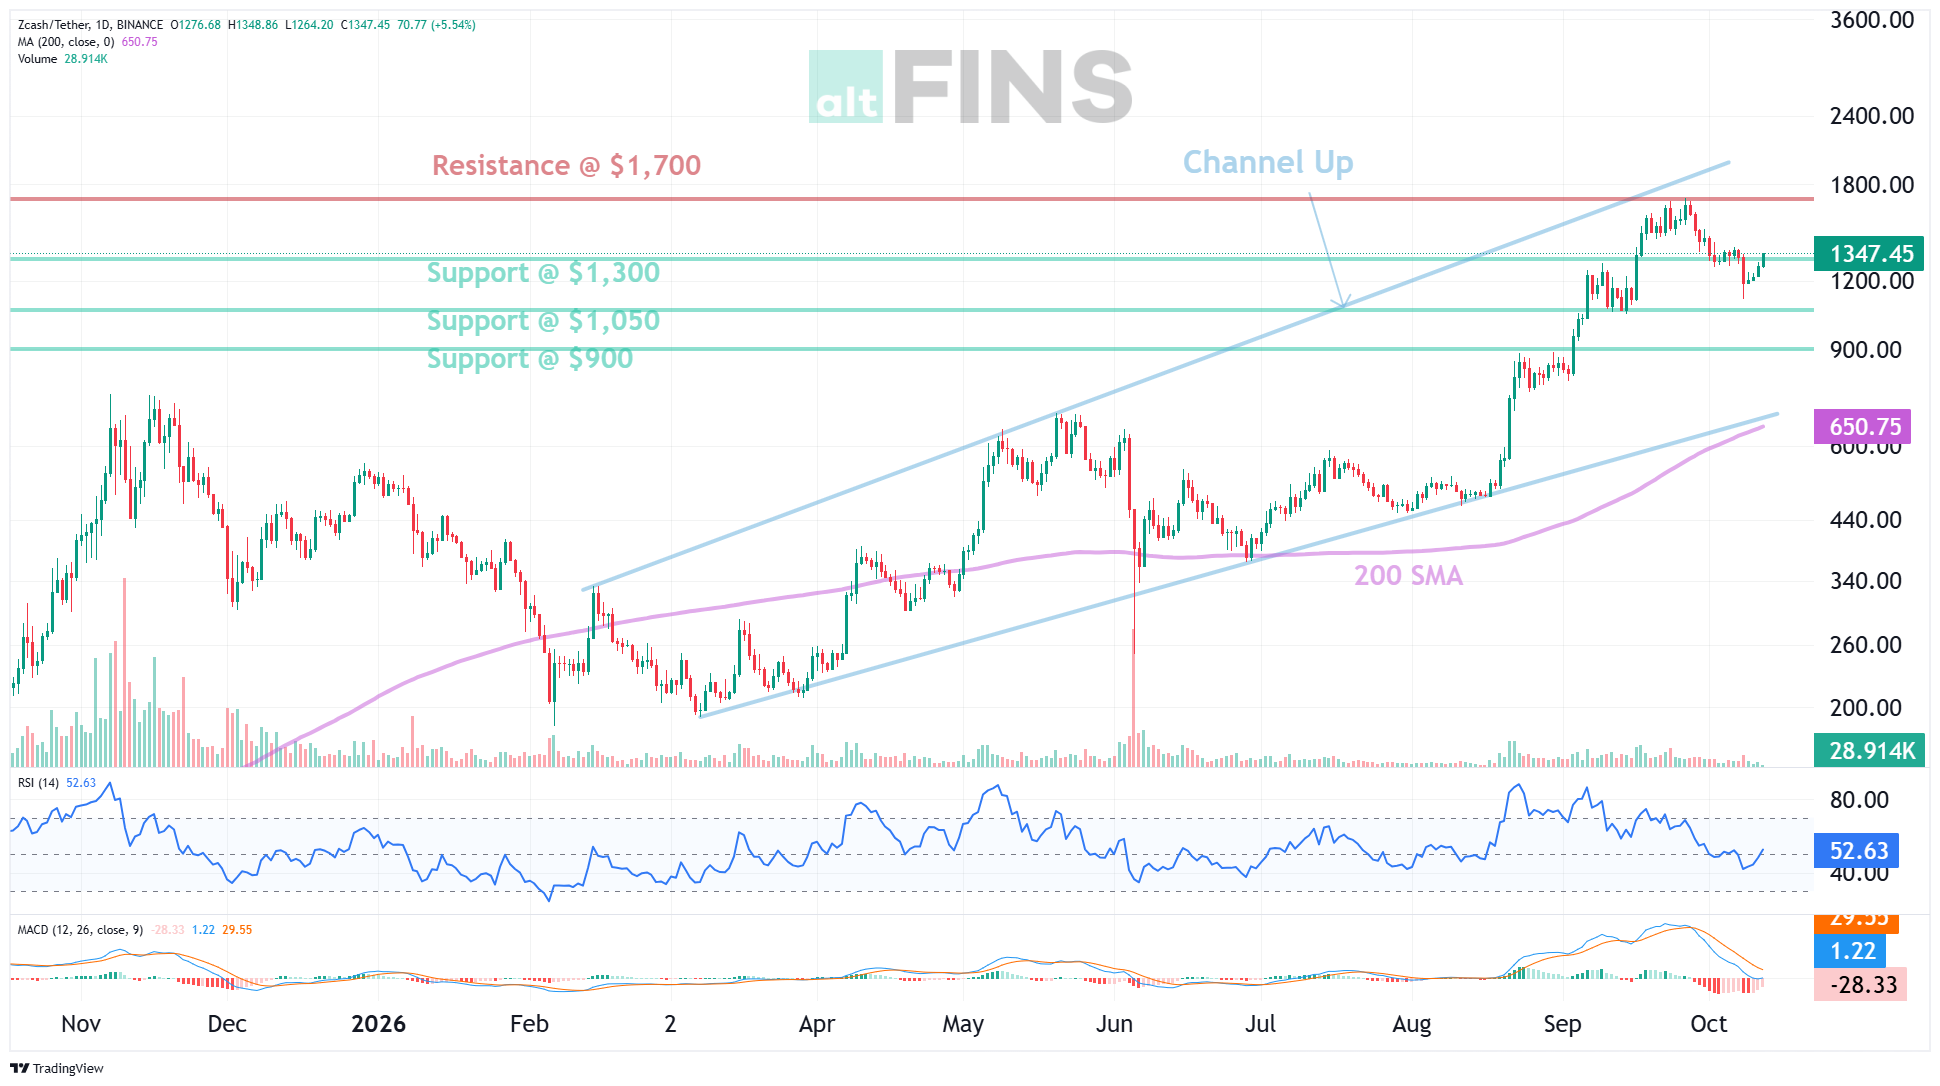
After soaring to a fresh ATH of $1,700, the asset faced strong resistance and was firmly rejected. This sent prices cascading downwards, eventually breaking below the crucial $1,300 support zone.
What does a "Support Breakout" mean? When a price breaks below a support level, it indicates that sellers have overwhelmed buyers at that price point. Demand couldn't keep up with supply, and this often signals that the price is likely to decline further, with the next closest support zone becoming the new target. If you want to dive deeper into this, you can learn to trade key level breakouts in Lesson 7 of this trading course.
Where Are We Heading Next?
Currently, the asset is eyeing the $1,050 - $900 zone. This range is shaping up to be a critical area where many traders will be looking for a potential swing trade entry. The strategy here is to buy into the pullback, aligning with the asset's underlying uptrend.
💡 Trader Tip: Don't miss this potential entry! Set a price alert for the $1,050 - $900 range so you're notified the moment the asset enters this zone.
Understanding the Trend & Momentum
- Short-term: The trend is currently Neutral.
- Medium-term: It's still firmly Up.
- Long-term: The trend is Strong Up.
This combination is crucial: while the short-term is uncertain, the broader picture remains bullish. This suggests the current pullback could indeed be a healthy correction within a larger upward movement.
Momentum Watch: Momentum is currently Bearish but showing signs of inflection. While the MACD Line is still below the MACD Signal Line, the MACD Histogram bars are rising. This is a subtle but important signal that selling pressure might be easing, and momentum could be gearing up for an upswing soon. The asset is neither overbought nor oversold, with RSI-14 levels comfortably between 30 and 70.
Key Levels to Monitor
Keep these price levels on your radar:
- Nearest Support Zones: $1,300.00 (broken), then $1,050.00.
- Nearest Resistance Zones: $1,700.00 (the recent ATH), then $2,000.00.
Your Next Steps
This pullback offers a calculated opportunity for traders who are prepared. Remember to:
- Monitor the $1,050 - $900 zone for potential entry.
- Set price alerts to catch the moment it hits your target.
- Learn more: Deepen your trading knowledge by exploring topics like breakout trading (Lesson 7) and risk management (Lesson 9).
Trading breakouts and managing risk are fundamental skills that can significantly improve your trading outcomes. Stay informed, stay prepared, and happy trading!