Diving Deep into the Downtrend: What's Next for This Crypto?
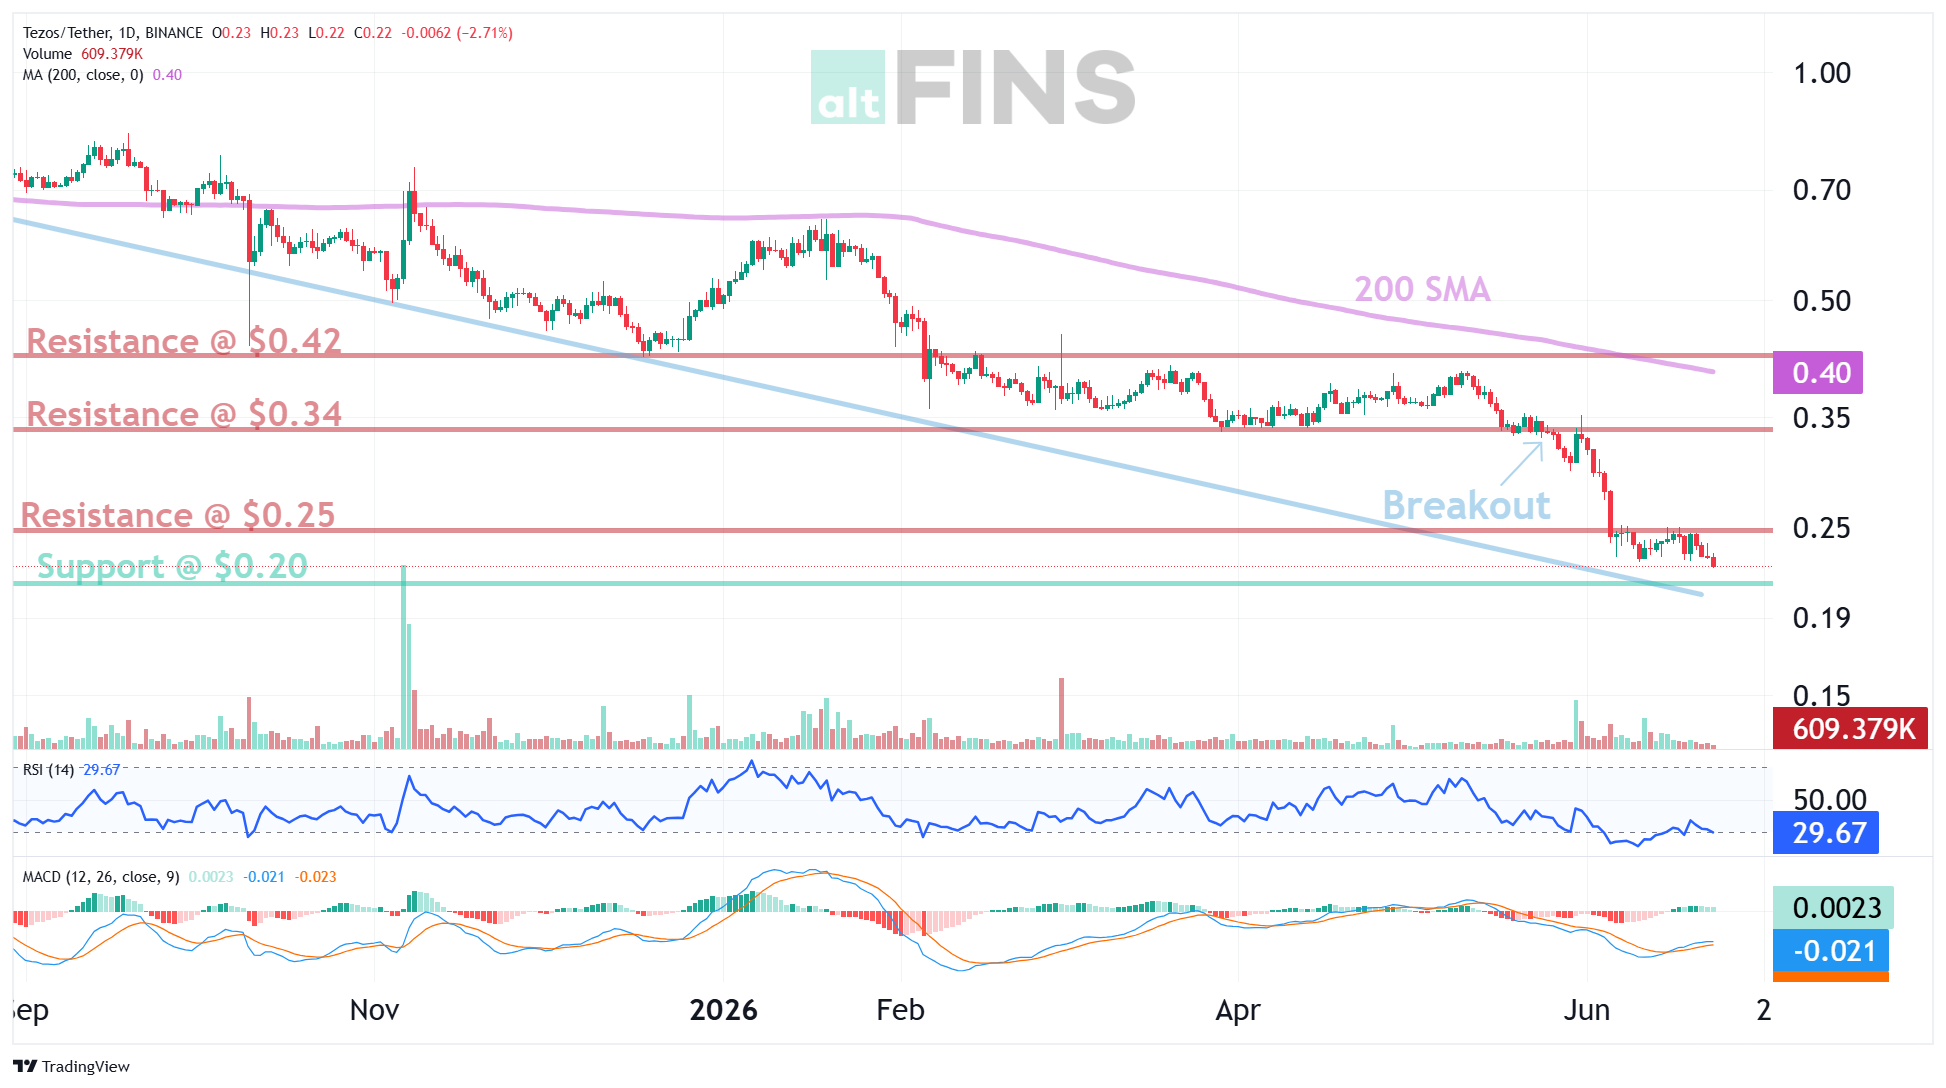
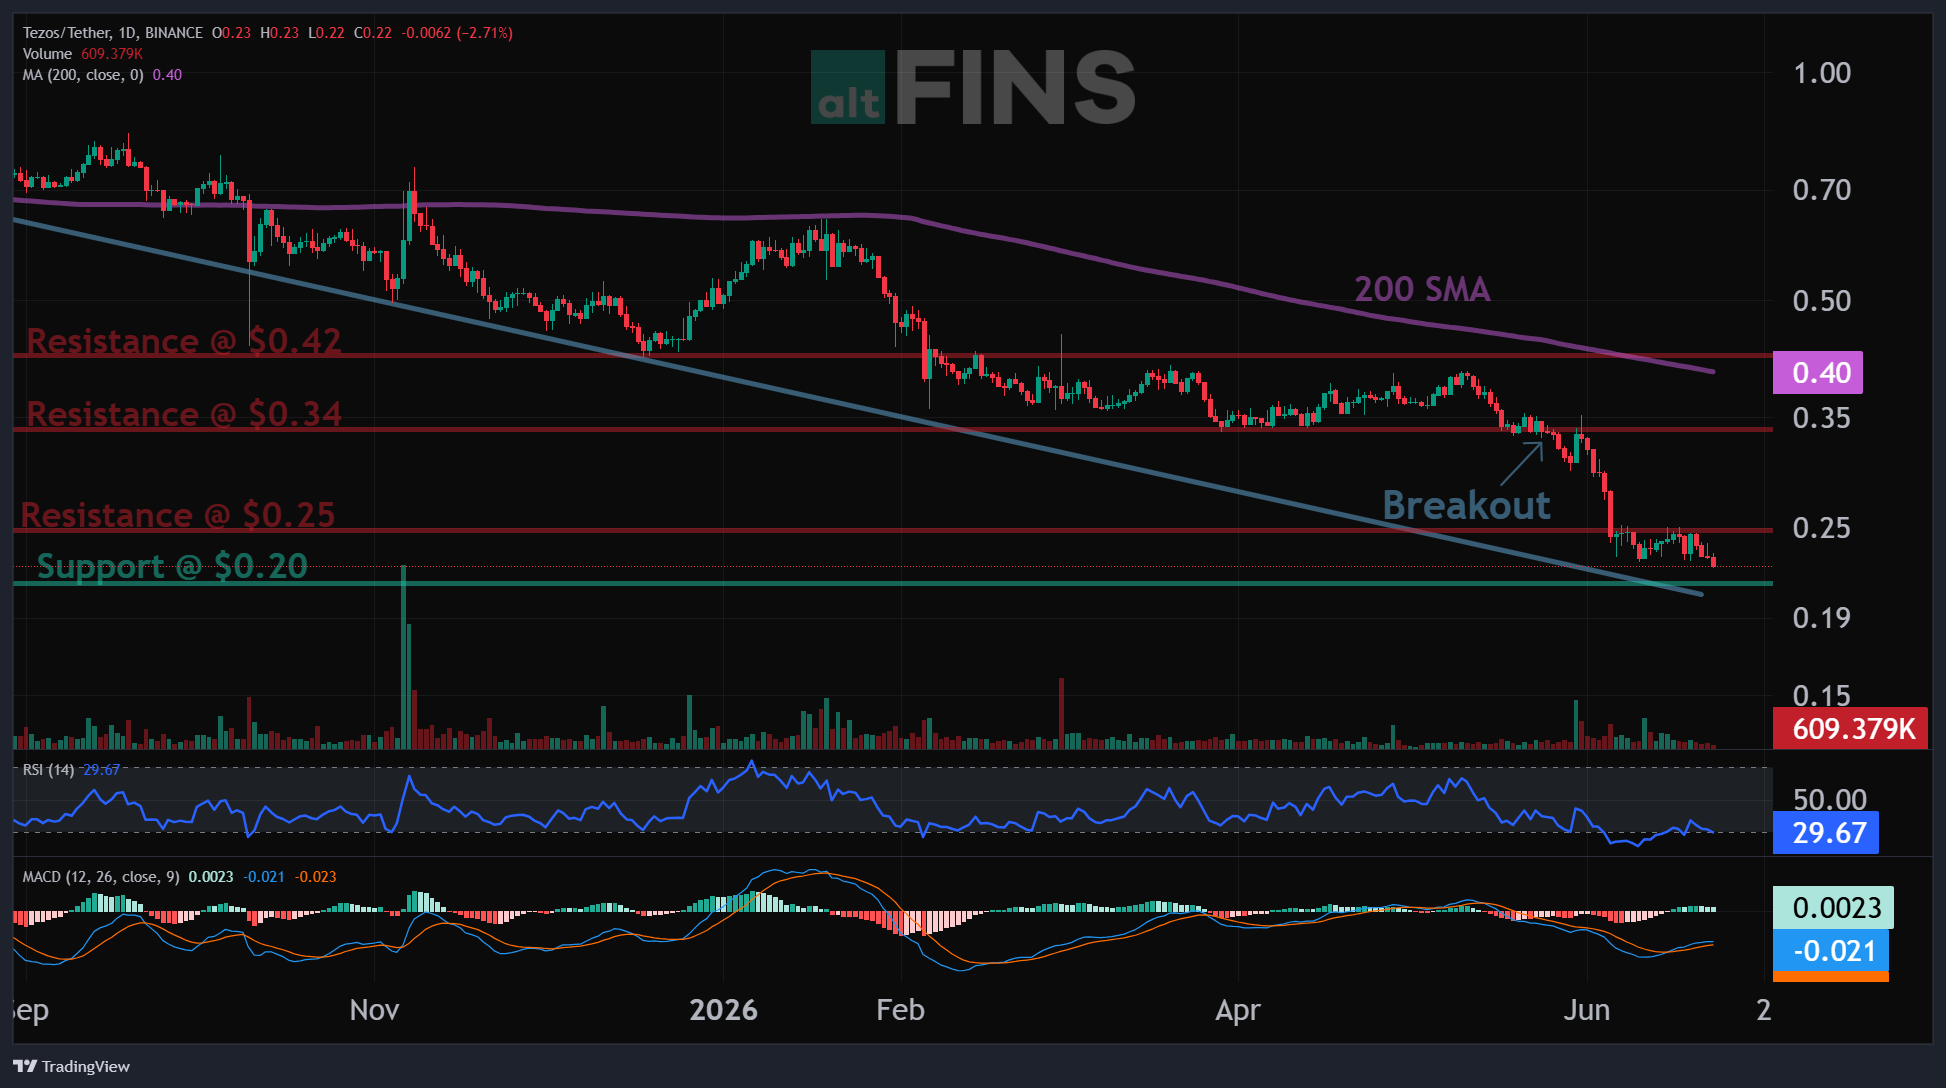
Is your portfolio feeling the chill of a bearish market? One particular crypto is sending strong signals, having just plunged to new 52-week lows, breaking a crucial support level at $0.30. This isn't just a minor dip; it's a clear indicator of a persistent downtrend. But what does this mean for traders, and where might prices head next? Let's break down the technicals.
The Bearish Breakdown: A New Low
The most significant event is the definitive break below the $0.30 support level. This isn't just a signal of weakness; it confirms a Downtrend and establishes new 52-week lows. For traders, this is a red flag indicating sellers are firmly in control.
Where's the Next Stop?
With $0.30 breached, the immediate focus shifts to the next significant support zone: $0.20. This is where prices could potentially pause or even attempt a temporary bounce. Savvy traders should consider setting a price alert at $0.20 to monitor for any reaction.
Want to master trading breakouts? Explore Lesson 7 of our trading course!
Approaching Support: A Potential Breather?
The price is now Approaching Support at $0.20. While a strong downtrend usually implies further downside, support levels are critical junctures. These are points where:
- Prices have historically found buyers.
- Prior resistance levels (once broken) can become new support (the polarity principle).
However, in a strong downtrend, support levels are more likely to act as temporary speed bumps rather than firm reversals. If $0.20 fails to hold, expect further decline.
Learn how to trade these crucial key levels in Lesson 7 of our trading course.
A Triple Threat Downtrend
The trend analysis paints a consistently bearish picture across all timeframes:
- Short-term trend: Strong Down
- Medium-term trend: Strong Down
- Long-term trend: Strong Down
This unanimous bearishness reinforces the dominant selling pressure and suggests that any bullish moves are likely to be short-lived corrective bounces within a larger decline.
Momentum Check: A Hint of Change?
While the trend is undeniably down, the Momentum indicator, particularly the MACD, offers an interesting nuance.
- MACD Line is still above the MACD Signal Line, which is typically bullish.
- However, the MACD Histogram bars are declining. This suggests that momentum, despite being technically bullish, may have peaked and could be nearing a downswing. This 'inflecting' momentum could precede a fresh wave of selling pressure.
The RSI-14 (Relative Strength Index) is currently neutral (between 30 and 70), indicating the asset is neither overbought nor oversold at this exact moment.
Confused about MACD? Get a clear explanation of the MACD Line and MACD Signal Line!
Key Price Levels to Watch
Understanding these zones is crucial for any trading strategy:
- Nearest Support Zone: $0.20 - The immediate downside target.
- Nearest Resistance Zone: $0.25, followed by $0.34. These are levels where sellers are likely to step in if the price attempts a bounce.
Trader's Takeaway: Navigate the Downtrend Wisely
Given the strong downtrend and new 52-week lows, here's what crypto traders should consider:
- Prioritize Risk Management: In bearish markets, capital preservation is paramount. Revisit Risk Management strategies in Lesson 9 of our trading course.
- Monitor $0.20 Closely: This is the next significant support. A break below it could open the door to even lower prices.
- Be Wary of "Bottom Fishing": While tempting, buying into a strong downtrend is high-risk. Wait for clear signs of a reversal or a confirmed bounce.
- Consider Shorting Opportunities: For experienced traders, a strong downtrend often presents opportunities for short positions, especially on bounces into resistance levels like $0.25 or $0.34.
- Stay Informed: Set those price alerts and keep an eye on market sentiment.
This analysis points to a challenging period for this crypto. While support at $0.20 could offer a temporary reprieve, the overarching trend is strongly bearish. Trade carefully and with a well-defined strategy!