
On-chain data is the publicly available information stored on a blockchain. Every transaction, block, and smart contract action is recorded forever in a digital ledger. This data is open to anyone, meaning you can see exactly how a blockchain is being used in real time.
It includes:
- Active Wallet Addresses – Shows how many wallets are actively sending or receiving funds. A steady rise means more users and stronger adoption.
- Exchange Flows (Inflows & Outflows) – Large inflows to exchanges often signal selling pressure. Large outflows suggest accumulation and long-term holding.
- Whale Transactions – Tracks movements of very large holders. Sudden spikes can mean big volatility is coming.
- NVT Ratio (Network Value to Transactions) – Compares market cap to transaction volume. High values can mean overvaluation, low values can mean undervaluation.
- HODL Waves / Coin Age – Measures how long coins stay untouched. More long-term holders usually means reduced selling pressure.
- Miner Activity – Tracks when miners are holding vs. selling. Heavy selling can push prices down, holding can be bullish.
- Gas Fees & Network Congestion – High fees mean strong demand for block space, often linked to NFT, DeFi, or altcoin booms.
- Stablecoin Supply on Exchanges – Shows how much ready-to-deploy capital is waiting. Rising supply can signal upcoming buying activity.
- Total Revenue & Protocol Revenue – Revenue going to the protocol or supply-side participants. Shows real adoption and economic strength.
- Total Value Locked (TVL) – Amount of funds locked in a protocol’s smart contracts. High TVL often means user trust and active usage.
- Market Cap Ratios (Mcap/TR, Mcap/PR, Mcap/TVL) – Compare a project’s value to its fundamentals. Lower ratios often indicate undervaluation.
Because the blockchain cannot be changed after transactions are confirmed, this information is accurate and trustworthy. That’s why on-chain data is valuable for building decentralized apps (dApps), running Web3 projects, and making better investment decisions.
On-Chain Data vs Off-Chain Data
It’s useful to compare on-chain data with off-chain data.
- On-chain data lives on the blockchain and is visible to everyone.
- Off-chain data is stored in traditional databases and servers outside the blockchain.
On-chain is transparent and permanent. Off-chain is private and can be changed.
On-Chain Data on AltFINS
AltFINS makes it easy to scan and analyze hundreds of crypto projects using real on-chain metrics. You can view:
- Total Revenue
- Market Cap to Total Revenue (Mcap/TR)
- Protocol Revenue
- Market Cap to Protocol Revenue (Mcap/PR)
- Total Value Locked (TVL)
- Market Cap to TVL
These metrics help investors find projects with real products and adoption — and avoid those that are overhyped or fraudulent.
Total Revenue
This is the sum of:
- Supply-side revenue: fees paid to validators or liquidity providers.
- Protocol revenue: fees that go to the project’s treasury or token holders.
You can see annualized revenue and performance changes over 7 and 30 days in the AltFINS screener.
Protocol Revenue
The share of fees that stays with the project itself, often sent to the treasury or used to burn tokens (reducing supply).
Mcap/TR (Market Cap to Total Revenue)
Similar to a price-to-revenue ratio in stocks. It compares the project’s market cap with its total revenue from the past 12 months. Lower values may indicate undervaluation.
Mcap/PR (Market Cap to Protocol Revenue)
Like Mcap/TR, but uses protocol revenue only. A low ratio can mean the market hasn’t fully priced in the project’s earning power.
TVL (Total Value Locked)
The amount of money locked into a project’s smart contracts. High and rising TVL shows confidence and strong participation.
Mcap/TVL (Market Cap to TVL)
Compares the project’s market cap with the total value locked.
- Below 1.0 → potentially undervalued
- Above 1.0 → potentially overvalued
Ask AI Copilot about On-chain Data
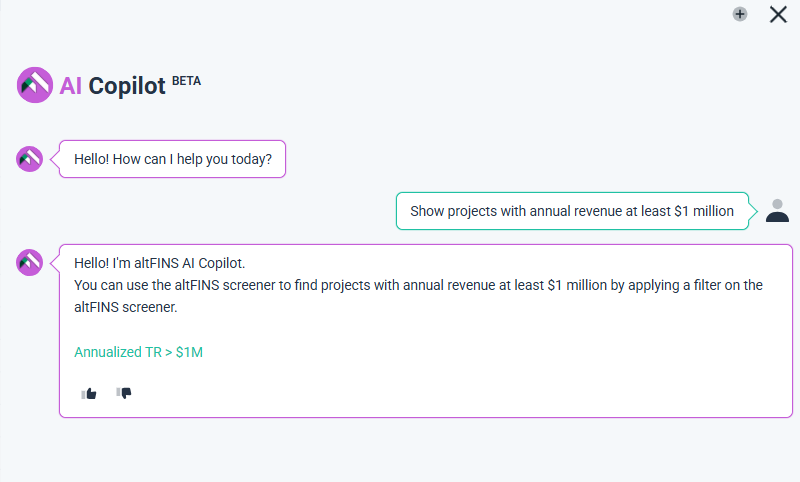
The AI Copilot’s Fundamentals suggestions help investors quickly find strong crypto projects based on real on-chain and fundamental metrics. It can highlight projects generating over $1 million in annual revenue, pointing to established protocols with sustainable demand.
It can also surface projects with revenue growth above 10% in the past month, often a sign of rising user activity and early momentum.
For value-focused investors, the Copilot can find tokens with a low Market Cap to Revenue ratio (under 10x), which may be undervalued relative to their earnings. DeFi traders can filter for projects with over $10 million in Total Value Locked (TVL), showing strong user confidence, or those with TVL growth of 10% or more, which indicates increasing deposits and traction.
Lastly, the Copilot can reveal protocols with a Market Cap to TVL ratio below 0.1x, often pointing to overlooked opportunities that could be undervalued by the market. Together, these filters allow users to discover high-potential projects backed by measurable fundamentals rather than hype.
Comparing Projects and Trends
In AltFINS, you can:
- Compare on-chain metrics across multiple projects in one chart
- Track trends over different timeframes
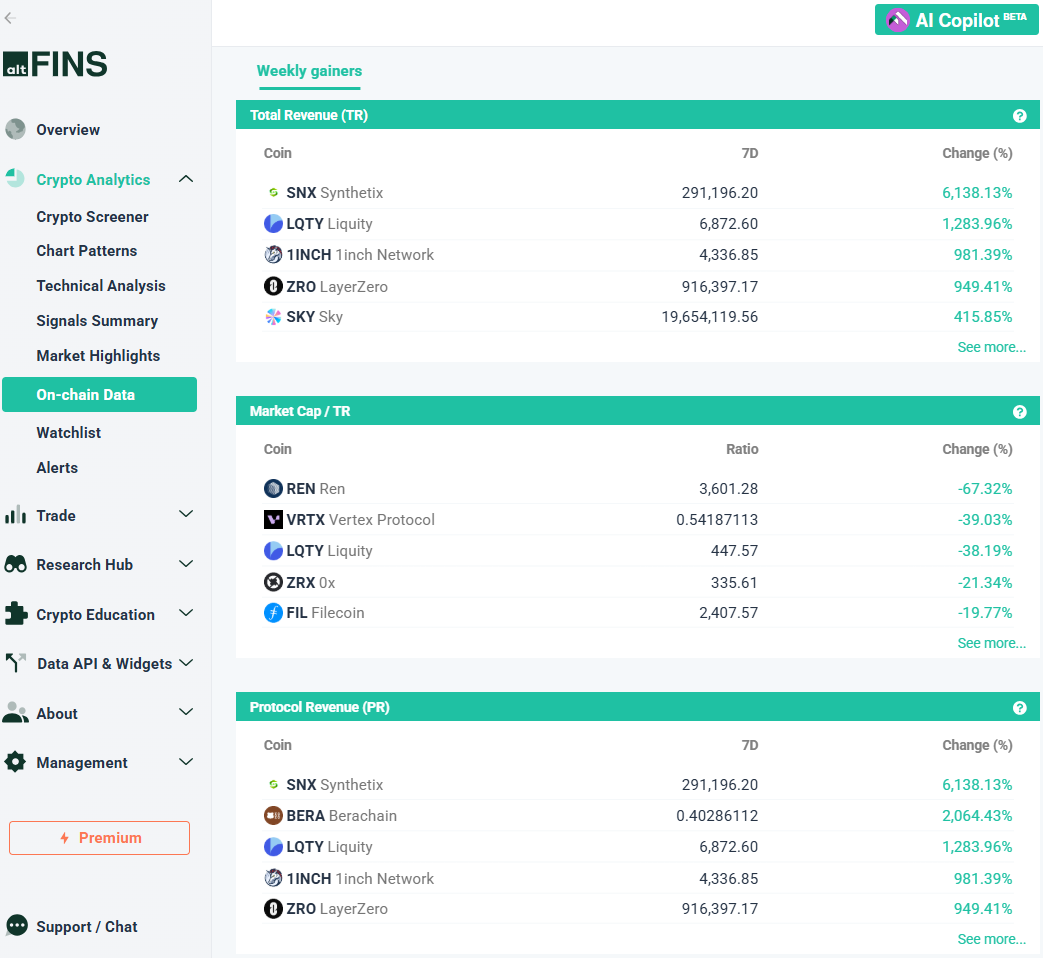
- See weekly gainers and losers for each metric
Example: In the DEX sector, you can compare revenue for UNI, DYDX, OSMO, 1NCH, and SUSHI, and see which is gaining traction fastest.
Why On-Chain Data Matters
On-chain data shows what’s really happening behind price charts:
- How much money is flowing into a project
- Whether usage is growing or shrinking
- If the project is valued fairly compared to its fundamentals
With AltFINS, you can turn this raw blockchain data into clear, actionable insights.
For example, in the DEX sector, you can compare revenue for UNI, DYDX, OSMO, 1NCH, and SUSHI, and quickly see which one is gaining traction. Weekly gainer and loser tables show changes in Total Revenue, Mcap/TR, Protocol Revenue, Mcap/PR, and TVL, helping you spot the strongest and weakest projects in a given week.
On-chain data reveals what’s really happening behind price movements, from money flowing into a project to changes in user activity and whether a project is valued fairly based on its fundamentals. With AltFINS, you can turn blockchain transparency into clear, actionable insights and even automate your trading strategies based on this data.