Breakouts! LEO, XTZ analysis and trade video
With altcoins on a tear, there are pattern breakouts everywhere. We found a couple worth highlighting: XTZ and LEO.
We’ve prepared a video with LEO analysis and trade (see below).
Also, if you enjoy this content, please helps us improve our platform by filling out this 5 question survey (1 min). Thank you!
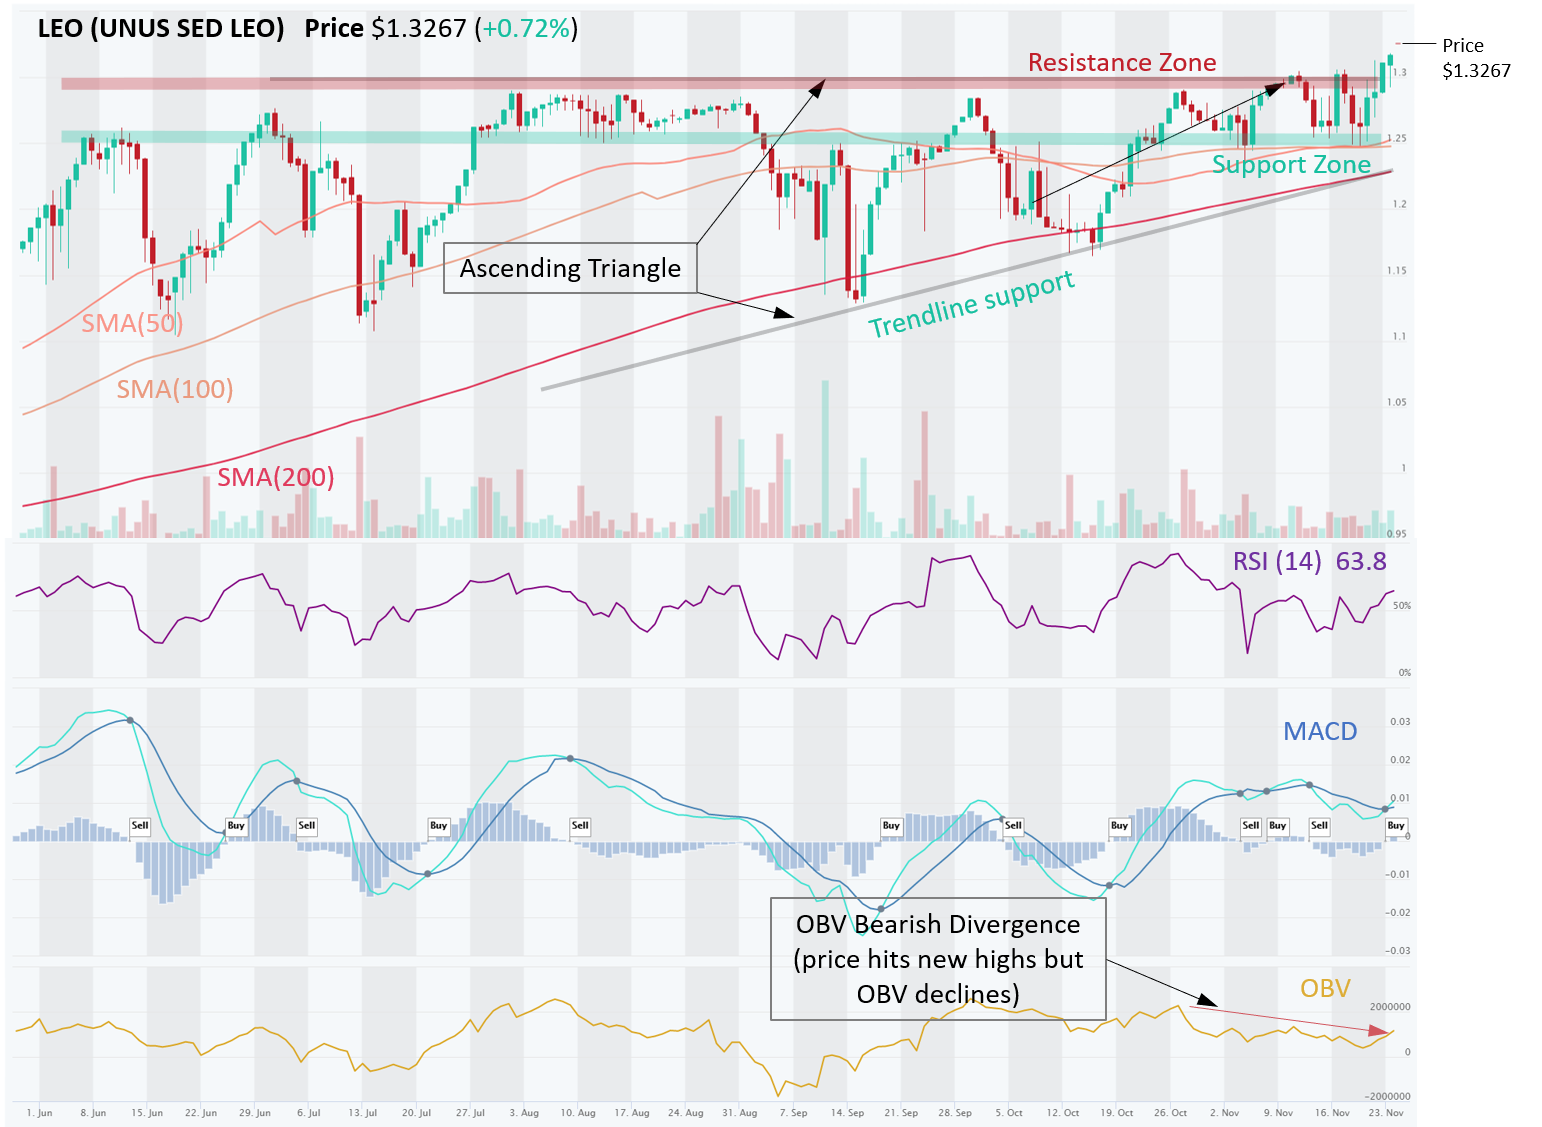
LEO – Bullish Breakout from an Ascending Triangle Could Lead To More Gains
LEO (UNUS SED LEO) is in an Uptrend across all time horizons (Short-, Medium-, Long-Term). Price was trading in an Ascending Triangle, which typically resolves in a bullish breakout, and it did just that. Strong Resistance Zone exists at $1.30, while the Support is at $1.25. The breakout from triangle and through the $1.30 resistance was confirmed by two candle closings, but OBV (volume on Up days vs Down days) is not making new highs yet, which is a divergence from price. In other words, the breakout is not so convincing. Momentum indicators have recently turned bullish (MACD Crossover and RSI > 50). Overall, the bullish evidence seems to outweigh bearish data points, which would point in favor of continued bullish price action.
XTZ – Breakout From a Falling Wedge Pattern on Big Volume; Room For Further Advances
XTZ (Tezos) price has reversed from a Downtrend to an Uptrend on a Short-Term basis, while Medium- and Long-Term trends are still Neutral. Price was trading in an Falling Wedge pattern, which tends to resolve in a bullish breakout, and it did just that in early Nov. Momentum indicators (MACD Crossover, RSI > 50) are still very bullish. In fact, RSI has been rising along with price, which is a confirmation, and OBV (volume on Up days vs Down days) has also risen, indicating that demand from buyers is growing. ADX of 21.15 is indicating good trend strength, and it is rising. Price is now attacking Resistance around $2.75 (coincides with a 200 Day SMA), which it already surpassed (see last candlestick in graph) but has not closed above it. If it does, that breakout could clear the way to $3.15 (next Resistance).

Download altFINS Mobile App
Follow us on:
✅ Telegram: https://t.me/altfinsofficialchat
✅ Twitter: https://twitter.com/AltfinsA
✅ Discord: https://t.co/uBvlTWgRgP
✅ Facebook: https://www.facebook.com/altFINS
✅ YouTube: https://t.co/QCvKBODSKH
✅ Reddit: https://www.reddit.com/user/altFINS_official
✅ Instagram: https://www.instagram.com/altfins_altcoins/
✅ LinkedIn: https://www.linkedin.com/company/altfins
Disclaimer: This content is for informational purposes only, you should not construe any such information or other material as investment, financial, or other advice. There are risks associated with investing in cryptocurrencies. Loss of principal is possible.