


Why Is Bitcoin Down Today? BTC Breaks $76K Support

Published September 16, 2026, 12:20 PM CET · Data verified live against altFINS market tools
Bitcoin price today is $75,885, down 1.44% on the day and 3.28% on the week. The drop followed the U.S. Senate’s failure to advance the CLARITY Act overnight, and it accelerated as traders de-risked ahead of today’s Federal Reserve rate decision. The move broke a support level that had held since August. Here is what the chart says happens next.
Quick answer: Bitcoin broke below $76,046 support on September 16, 2026 after the Senate stalled the CLARITY Act. The medium-term trend is still rated Strong Up. A daily close back above $76,046 keeps this a buy-the-dip setup targeting $82,258. A close below $66,954 would signal a deeper correction toward $62,525.
What Happened to Bitcoin Today
The U.S. Senate fell short on a cloture vote for the CLARITY Act, crypto’s market-structure bill, by a 49-50 margin overnight. The bill is not dead. The vote can be brought back. But the procedural defeat extended the regulatory uncertainty the market had priced out, and selling accelerated as a result. CryptoSlate reported Bitcoin dropping below $76,000 in the hours after the vote failed, with spot and perpetual futures selling both deepening.
On the altFINS screener, BTC sits at $75,885 with RSI14 at 44.9. That is a pullback from overbought conditions, not oversold. The short-term trend rating has downgraded to Neutral (5/10). The medium-term trend remains Strong Up (9/10).
Key Bitcoin Price Levels to Watch
The level that broke today, $76,046, was the most recent support on the altFINS screener. It was set during the rally that followed Bitcoin’s breakout above its 200-day moving average in August. Under the polarity principle, a broken support level tends to flip into resistance the next time price approaches it from below. That makes $76,046 the level bulls need to reclaim to stay in control.
| Coin | Price | 1D | 1W | 1M | RSI 14 | Trend (MT) |
|---|---|---|---|---|---|---|
| BTC, Bitcoin | $75,885 | -1.44% | -3.28% | +20.31% | 44.9 | Strong Up |
| ETH, Ethereum | $2,404 | -2.89% | -3.28% | +27.70% | 48.4 | Strong Up |
- Resistance 1, $82,258. The next level up if BTC reclaims $76,046. Roughly where the current up-leg stalled last week.
- Lost support, $76,046. Broken today. The level to reclaim on a daily close for the pullback thesis to stay intact.
- Support 1, $66,954. The next real support on the screener, and the resistance-turned-support zone from July’s breakout. altFINS’ curated technical setup already flags this as the area for value buyers on a deeper pullback.
- Support 2, $62,525. Comes into play only on a daily close below $66,954.
How Ethereum Reacted
Ether fell in step with Bitcoin, down 2.89% to $2,404, and broke its own nearest screener support at $2,424 within the same window. ETH’s medium-term trend rating is unchanged at Strong Up (10/10). Like BTC, its RSI14 (48.4) shows no sign of oversold conditions. This reads as a market-wide de-risking event, not an Ethereum-specific breakdown.
Why Today’s Fed Rate Decision Matters for Bitcoin
The Federal Reserve hands down its rate decision at 2pm ET. Per the CME FedWatch tool, the market is pricing a 92.3% probability of a 25-basis-point hike to a 3.75% to 4.00% target range, according to CryptoPolitan. Higher rates raise the opportunity cost of holding non-yielding assets like Bitcoin. They also tend to tighten the liquidity conditions that have supported this year’s risk-on rally. That is the second, larger catalyst layered on top of the CLARITY Act news, and it is the main reason volatility is elevated into today’s close.
Is Bitcoin’s Uptrend Over, or a Healthy Pullback?
Context matters here. Bitcoin is still up 20.31% over the past month even after today’s decline, and the medium-term trend rating has not moved from Strong Up. A pullback of this size inside a trend this strong is normal, not a reversal signal. RSI14 at 44.9 confirms there is no exhaustion to work off before buyers can step back in.
The scenario to watch: a daily close back above $76,046 keeps this a buy-the-news dip, with $82,258 as the next target. A daily close below $66,954 would be the first real technical break of the uptrend structure, opening a path to $62,525. Until one of those levels gives, this is a pullback inside an uptrend, not a top.
Bitcoin Technical Chart Analysis
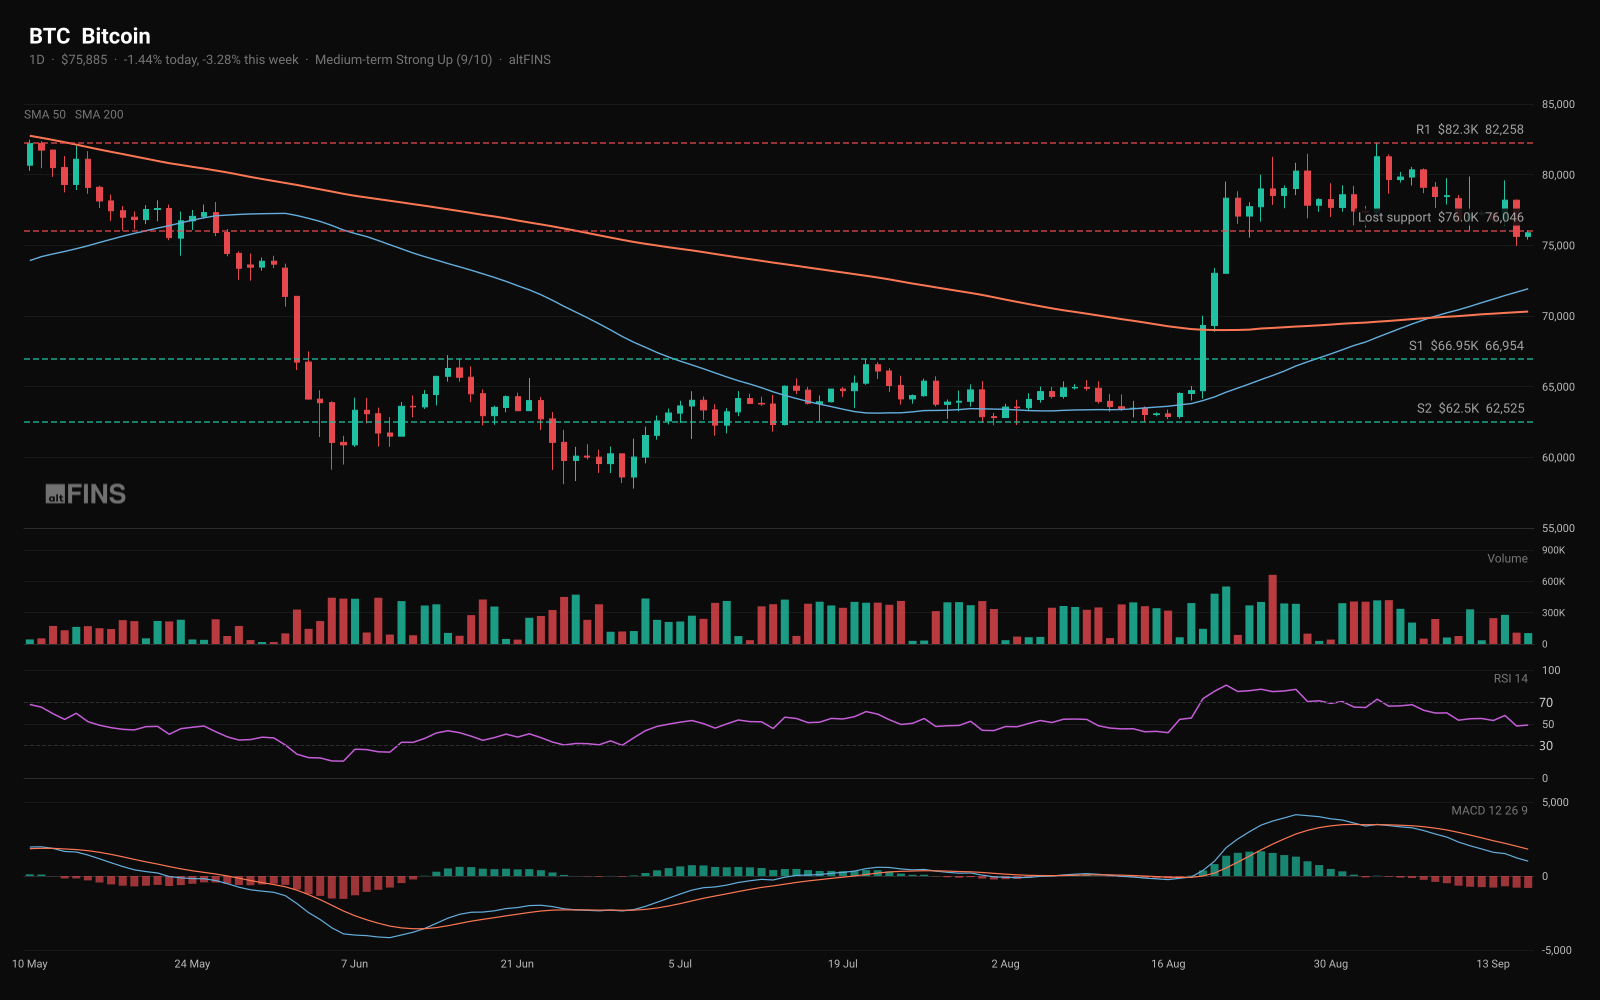 BTC/USD daily. Lost $76,046 support this morning; $66,954 is the level that keeps the uptrend thesis alive. Source: altFINS.
The daily chart shows price pulling back from the recent high after a strong August breakout above both the 50-day and 200-day moving averages, which remain in a bullish configuration (50 above 200). MACD has crossed below its signal line, but the histogram is only mildly negative, consistent with a pause rather than a trend break. RSI14 has room to fall further before flagging oversold, which is typically where these pullbacks find buyers.
Key Takeaways
- BTC broke its $76,046 screener support after the Senate stalled the CLARITY Act. ETH broke its own nearest support the same day.
- Both assets remain rated Strong Up on the medium-term trend, with RSI readings well short of oversold.
- The Fed’s rate decision at 2pm ET (92% odds of a hike, per CME FedWatch) is the larger catalyst driving today’s volatility.
- $76,046 is the level to reclaim for bulls. $66,954 is the level that would confirm a deeper correction if lost.
- BTC is still up 20.3% on the month. This reads as a pullback inside an uptrend, not a reversal.
Frequently Asked Questions
Why did Bitcoin drop below $76,000 today?
Bitcoin fell after the Senate failed a cloture vote (49-50) on the CLARITY Act. The selloff accelerated as traders de-risked ahead of today’s Fed rate decision, pushing BTC through the $76,046 support level.
What is the CLARITY Act and why does it matter for crypto?
It is proposed U.S. legislation that would clarify which federal agency regulates which digital assets. The failed procedural vote does not kill the bill, but it extends the regulatory uncertainty markets had been pricing out.
What price level would confirm Bitcoin’s uptrend is over?
A daily close below $66,954, the next support level on the altFINS screener, would be the first real technical evidence that the uptrend structure is breaking down.
Track these levels live on the altFINS screener, with the same trend ratings, RSI, and support and resistance data used in this article, or see how the current setup compares to a confirmed double top and double bottom reversal pattern.
Open the Free Bitcoin Screener on altFINS
This article is for educational purposes only and is not financial advice. Price levels, trend ratings, and every other technical indicator describe historical and current market data and do not guarantee future results. Cryptocurrency trading involves substantial risk of loss; always use a stop-loss and never risk more than you can afford to lose.
Related Posts

 Written byLenka Fetyko
0 Comments
Leave a comment