Trading Descending Triangles (Short Sell Opportunities)

Bearish Setups Emerging: Descending Triangles
By Richard Fetyko, CEO and Founder of altFINS
Last week, I discussed a bullish trade setup for SOL (Solana), which was trading in an Ascending Triangle pattern.
But I’m also noticing many assets trading in Descending Triangle patterns, which usually result in bearish breakouts.
It’s the opposite of Ascending Triangle patterns — and these triangles are nearing their pinnacle, which means a breakout in either direction is nearing (probably this week).
BTC – Break Below Support
(Daily Time Interval)
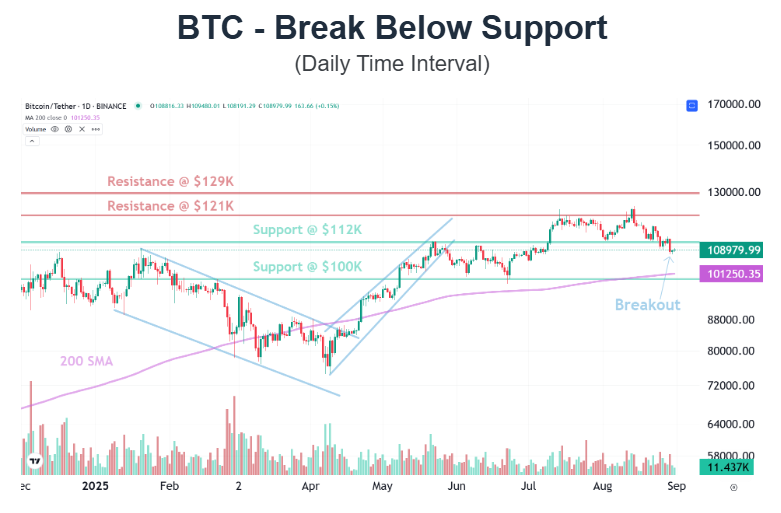
With BTC breaking below the $110K–$112K support zone, it feels like the market could pull back a bit more before resuming its Uptrend — driven by expectations of FED rate cuts.
Of course, there’s lots of uncertainty regarding rate cuts due to higher inflation data but lower unemployment… mixed macro signals.
How I’m Hedging: Short Selling Bearish Breakouts
It may make sense to hedge my portfolio by short selling assets that are breaking down from Descending Triangle patterns.
That way, if the market enters a deeper correction, I can profit from the price declines.
FET – Emerging Descending Triangle
(Daily Time Interval)
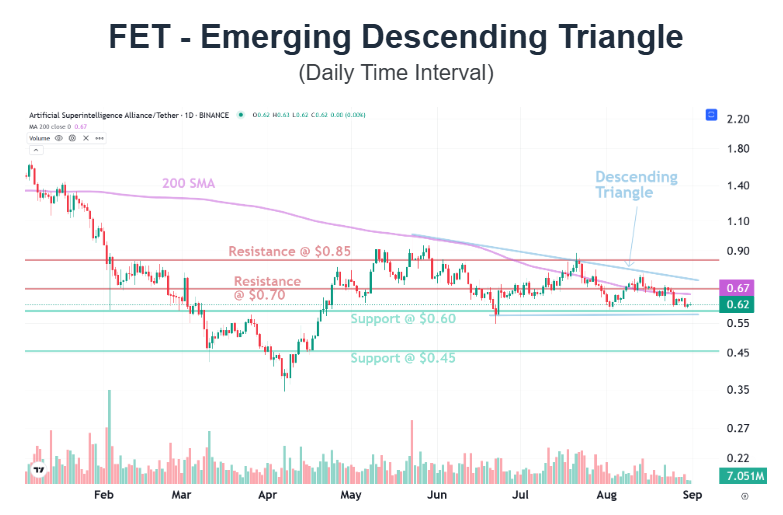
The chart below is an example of an emerging Descending Triangle.
It’s “emerging” because price hasn’t broken out of the pattern yet.
Notice how price has bounced off the $0.60 support level a few times — but each bounce is smaller, forming a down-sloping trendline. This indicates growing selling pressure and weakening buyers.
Price is also in a Downtrend, based on altFINS’ trend ratings. If the price breaks below $0.60, that could signal a bearish breakout in the direction of the existing Downtrend, likely followed by further weakness.
Find More Setups Like FET
You can discover more setups like FET in our Technical Analysis section as well as in the Chart Patterns section.
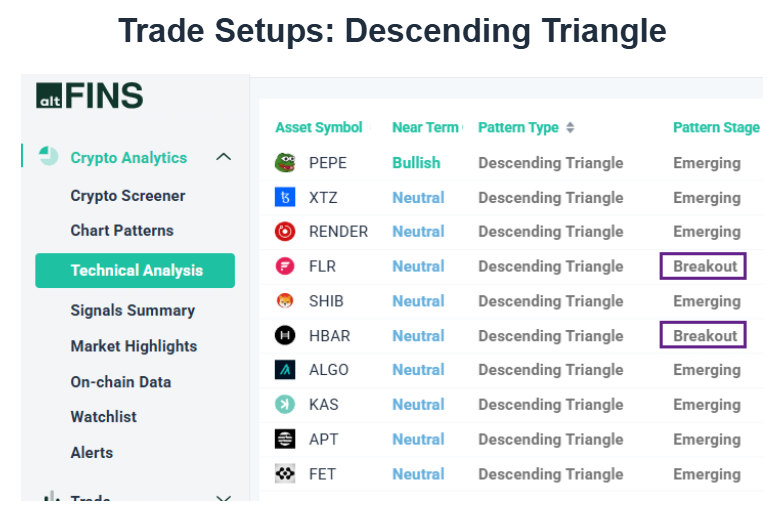
Trade Setups: Descending Triangle
I prefer to short sell assets that are already in a Downtrend — remember: “The trend is your friend.”
So far, two assets that broke down from Descending Triangles were HBAR and FLR, but they are still technically in an Uptrend (trading above their 200 SMA). So I’m focusing on assets that:
- Are trading in emerging Descending Triangles
- Are already in a Downtrend or approaching 200 SMA support
Watchlist:
- XTZ – $0.70 support
- RENDER – $3.30 support
- SHIB – $0.000012
- ALGO – $0.22
- KAS – $0.08
- APT – $4.00
- FET – $0.60
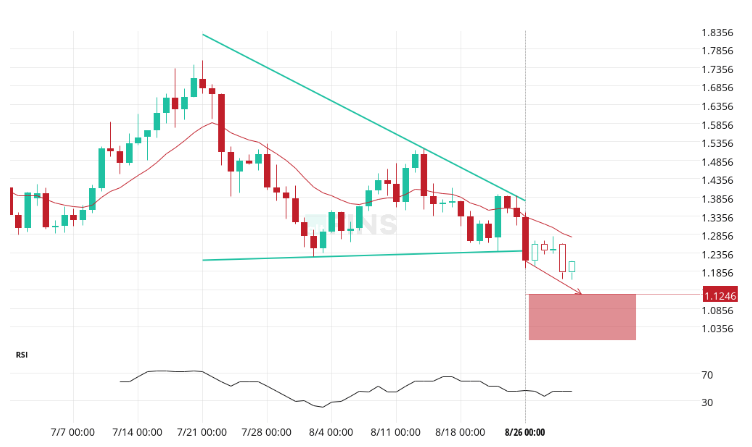
My Favorite Bearish Breakout: RUNE
You’ll also find many bearish breakouts from Downtrend assets in our Chart Pattern section (live screener results).
Of those, I like RUNE, which broke down from a Descending Triangle pattern while already in a Downtrend. My price target: $1.12.
Learn more about Ascending Triangle Patterns
Learn more about Descending Triangle Patterns


0 Comments
Leave a comment