Top Crypto Trading Opportunities
The current crypto market is navigating a broadly bearish environment, with most major assets trading below their 50- and 200-day moving averages and altFINS trend scores reflecting weakness across all timeframes. However, altFINS data reveals a small number of standout setups where technical structure, on-chain flows, and protocol fundamentals converge — offering high-conviction opportunities for disciplined traders.
This article highlights five actionable ideas: two strong buys where all data layers align, two contrarian accumulation setups supported by institutional flows, and one fundamental watch for longer-term investors. It also identifies the key tokens to avoid.
Market Overview
altFINS trend scores (0–10 scale across short, medium, and long-term timeframes) are broadly depressed. Most large-cap tokens score 0–2/10 across all three timeframes, confirming the bearish macro backdrop. RSI readings cluster in the 30–45 range — technically oversold but not yet showing reversal signals. MACD gaps are narrowing on select tokens, hinting that momentum may be approaching a bottom.
Against this backdrop, the analysis focuses on relative strength: tokens holding uptrends while the broader market declines, and assets where on-chain positioning diverges from price action.
Analysis Summary
| Token | Price | RSI (14) | Trend Score | 30d Fees | 30d Revenue | Verdict |
|---|---|---|---|---|---|---|
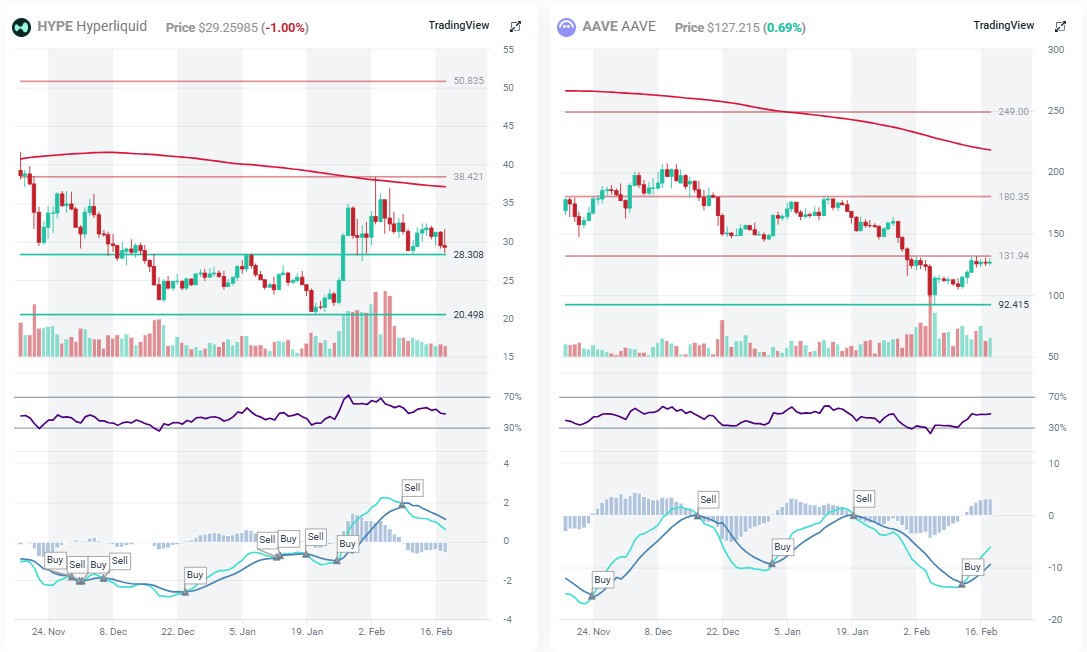
| HYPE | $29.10 | 47 | MT: 7/10 ✅ | $72.7M (+58%) | $72.7M (+58%) | 🟢 Strong Buy |
| AAVE | ~$185 | ~42 | Downtrend | $93.9M (+49%) | $16.0M (+85%) | 🟢 Buy on Reversal |
| BTC | $67,282 | 34 | Strong Down | $6.5M (-5%) | — | 🟡 Contrarian |
| LINK | $8.70 | 37 | Strong Down | $4.5M (-1%) | $4.3M (-5%) | 🟡 Contrarian |
| CC | $0.167 | 53 | All timeframes ✅ | — | — | 🟠 Technical Only |
| ETH | $1,969 | 34 | Strong Down | $19.2M (+92%) | $4.9M (+257%) | 🟠 Watch |
| SOL | $82.76 | 34 | Strong Down | $27.0M (+22%) | $2.4M (-9%) | 🔴 Avoid |
| SHIB | $0.0000064 | 44 | Weak | — | — | 🔴 Avoid |
| AVAX | ~$26 | ~35 | Strong Down | $287k (+17%) | $287k | 🔴 Avoid |
| ADA | $0.28 | 43 | Strong Down | $88k (-26%) | $17k | 🔴 Avoid |
🟢 Strong Buy Setups
$29.10
30d Fees: $72.7M (+58%)
Support: $28.30 | Target: $34–38
Hyperliquid is the standout trade in this analysis — the only token where all data layers align bullishly. Its medium-term trend score of 7/10 is rare in a market where most tokens sit at 0–2/10. RSI at 47 is healthy and not overstretched, and price is sitting exactly at the Bollinger Band lower boundary near the key $28.30 support level. MACD is positive and holding.
The fundamental picture reinforces the technical case. altFINS data shows $72.7M in protocol fees and revenue over the last 30 days — the single highest figure across all tokens in this study, growing at +58% month-over-month. Critically, fees equal revenue (100% accrues to the protocol), which is structurally bullish for the HYPE token. This metric outpaces Aave, Uniswap, Solana, and Ethereum combined.
~$185
Trend: Downtrend
30d Fees: $93.9M (+49%)
TVL: $43.9B
Aave presents one of the strongest fundamental pictures in DeFi, but the technical picture requires patience. altFINS shows $93.9M in total fees and $16.0M in protocol revenue over 30 days — fees up +49% and revenue up +85% month-over-month. Total Value Locked sits at $43.9 billion, the largest of any DeFi protocol tracked. This is a protocol that is genuinely growing revenue at scale.
All trend scores remain in downtrend territory, price sits below SMA50 and SMA200, and there is no technical reversal signal yet. On-chain flows show accumulation by informed participants with no evidence of distribution — this is being accumulated, not sold.

🟡 Contrarian Accumulation Setups
$67,282
Trend: Strong Down
30d Fees: $6.5M (-5%)
Top PnL Flow: +5.5x avg
Bitcoin’s technical chart is weak — all trends sit at 0–1/10, RSI at 34, price well below both SMA50 and SMA200. On the surface this looks like a clear avoid. But the on-chain flow data tells a different story.
Top PnL wallets are buying at 5.5x above their average, accumulating approximately $2.4M in 24 hours. Meanwhile, exchange outflows of $4.6M indicate coins are moving off exchanges — the classic pattern of strong hands buying into weakness. altFINS network fee data ($6.5M over 30 days, down only 5.2%) confirms stable miner economics — the price decline is sentiment-driven, not a sign of network stress.
$8.70
Trend: Strong Down
30d Revenue: $4.3M
Support: $7.17
Chainlink is the most compelling contrarian setup in the altcoin space — a combination of deeply discounted price, stable fundamentals, and large wallet accumulation. altFINS data shows $4.5M in fees and $4.3M in protocol revenue over 30 days — a near-95% revenue margin and one of the highest efficiency ratios tracked. Revenue declined only 5.3%, demonstrating resilience despite the price drop.
On-chain flows show whale wallets accumulating at 1.8x above average, with MACD gap narrowing — a setup where stable fundamentals + on-chain accumulation + oversold price converge at a key support level.
🟠 On Watch
Technical Only
The cleanest pure technical chart in this analysis. All three trend timeframes are bullish (ST: 7/10, MT: 6/10, LT: 10/10), MACD is positive, and price is above SMA50 at $0.154. Upper Bollinger Band at $0.187 provides a near-term target. This is a momentum trade — size accordingly.
Fundamental watch
Ethereum’s fundamentals have improved dramatically — altFINS shows $19.2M in fees (+92%) and $4.9M in revenue (+257%) over 30 days. Network activity is genuinely picking up. However, all technical trend scores remain at 0–2/10 (Strong Down), RSI at 34, price well below SMA50 and SMA200. The fundamental rebound creates a longer-term thesis. Add to watchlist — wait for trend scores to recover above 4/10 before acting.
🔴 Assets to Avoid
Solana has real fundamentals — altFINS shows $27M in fees and $2.4M in revenue over 30 days, with fees growing +22.5%. But on-chain data reveals active distribution: whale outflows running 1.3x above average ($4.2M), public figures net selling, and coins flowing onto exchanges at 2.1x the average rate — the classic precursor to sell pressure. Strong fundamentals do not protect against coordinated distribution. Avoid until the distribution pattern exhausts.
Despite a 6.6% weekly gain, altFINS on-chain data shows Top PnL wallets selling at 22.2x above their average — a massive distribution event. Exchange outflows of 10.8x average ($3.5M) confirm smart money is exiting into the bounce, offloading to retail buyers attracted by the weekly gain. No protocol fundamentals exist to offset this signal. Strong avoid.
These tokens share a common profile: Strong Down trend scores across all three timeframes (0–3/10), price well below SMA50 and SMA200, RSI in the 29–43 range with no reversal patterns, and minimal or nonexistent protocol fundamentals. BNB at RSI 29 is the most technically oversold in the group but shows no catalyst for reversal.
Methodology & Data Sources
All data in this report is sourced from the altFINS platform, which aggregates technical indicators, on-chain wallet analytics, and fundamental protocol metrics including fees, revenue, and total value locked. Trend scores use a proprietary 0–10 scale across short-term, medium-term, and long-term timeframes. Fee and revenue data reflects 30-day cumulative figures with month-over-month trend comparison.
Disclaimer: This article is for informational purposes only and does not constitute financial advice. Cryptocurrency markets are highly volatile. Always conduct your own research before making investment decisions.
0 Comments
Leave a comment