Profiting from Crypto Market Corrections with AI Chart Patterns

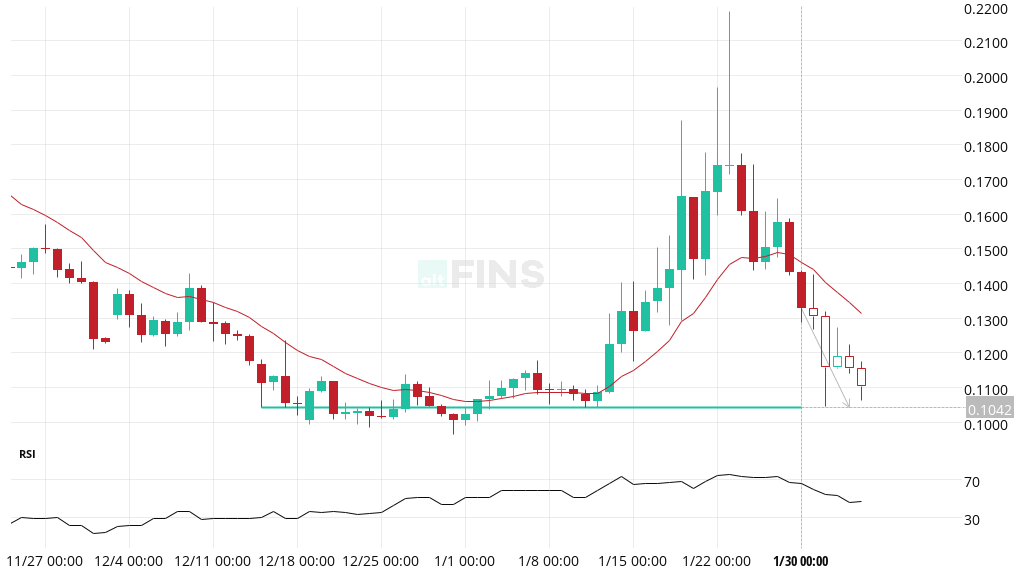
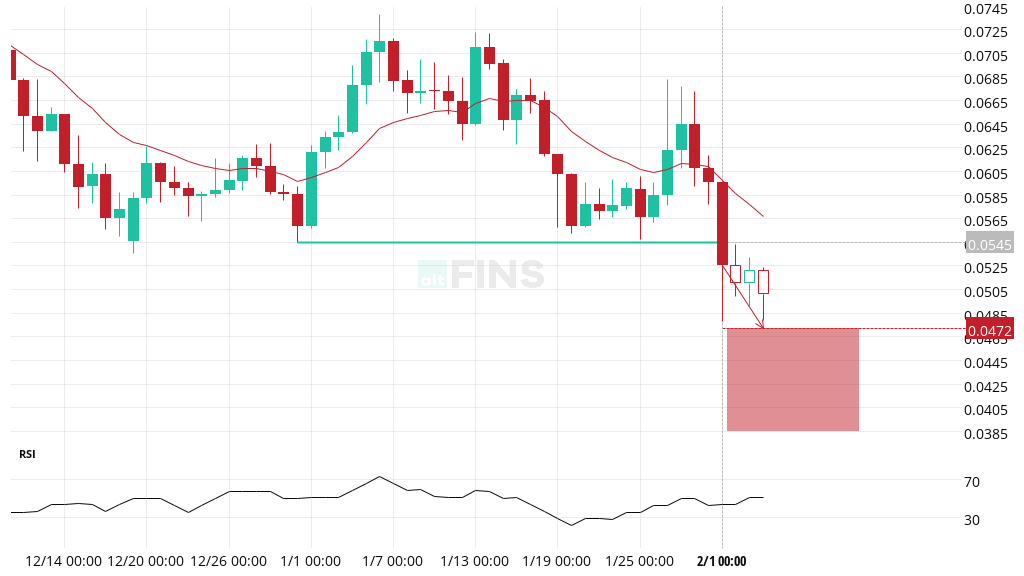
As the cryptocurrency market experiences corrections or downtrends, savvy traders can capitalize on these movements using advanced tools like our AI-based Chart Pattern recognition system. This system identifies lucrative opportunities on the sell side by spotting bearish patterns and support level breaks, allowing traders to profit from price declines through short selling.
Why Short Selling?
When prices approach or break below support levels or experience bearish breakouts from patterns, further declines are often likely. Short selling allows traders to profit from these downward movements. This strategy involves borrowing assets to sell at the current price and then buying them back at a lower price, pocketing the difference.
Learn Short Selling in Our Crypto Trading Course!
Our comprehensive Crypto Trading Course, particularly Lesson 10, focuses on short selling and identifying assets suitable for this strategy. The course covers seven trading strategies for any market stage, along with risk management and leverage trading techniques. Our students have praised the course for its thoroughness and effectiveness (check reviews here).
Recent High-Performance Trade Signals
Our AI-based system has recently generated impressive trade signals with significant profits:
Note that the empty price candles came after the signal was generated.
MINA: Pennant Breakout (+18% Profit)
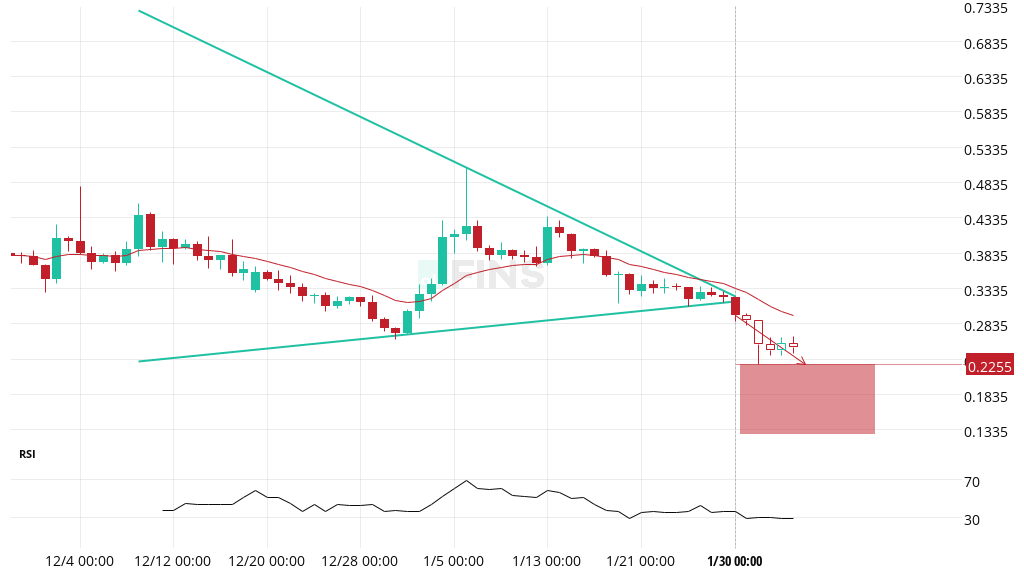
WIF: Triangle Breakout (+22% Profit)
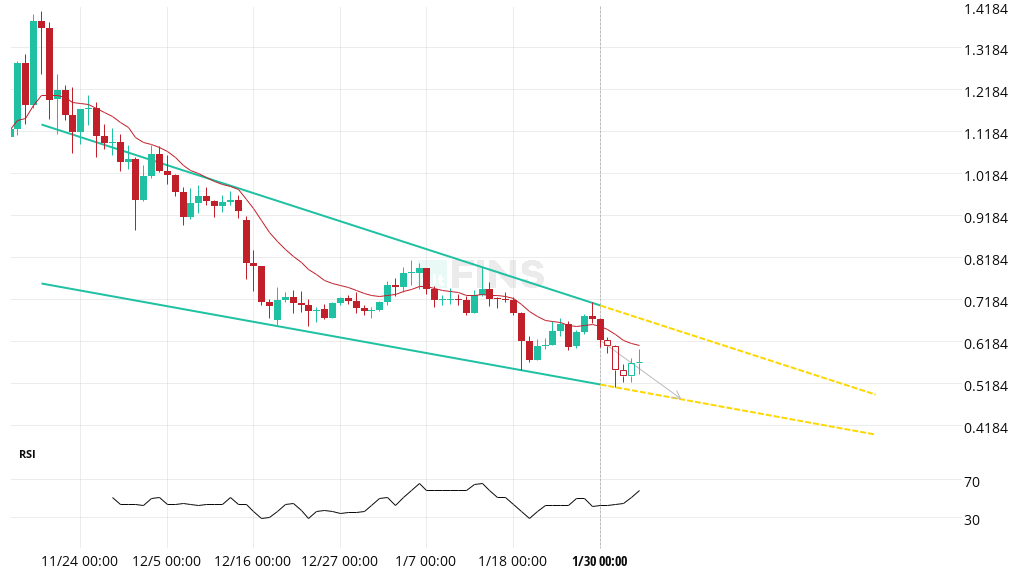
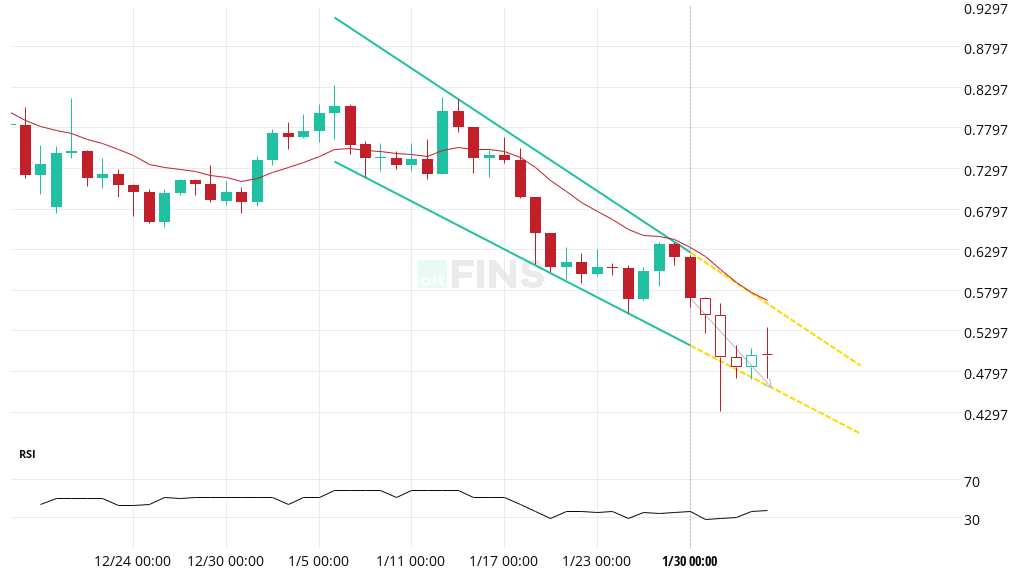
ASTER: Channel Down (+16% Profit)
ETHFI: Falling Wedge (+23% Profit)
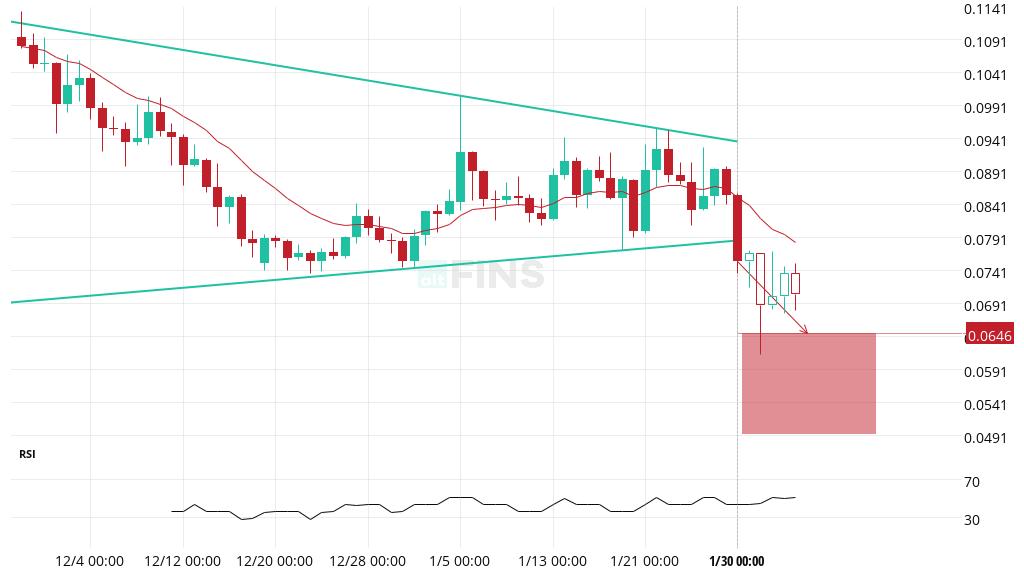
SCRT: Support Approach (+21% Profit)
PYTH: Resistance Breakout (+10% Profit)
Efficient Monitoring with altFINS
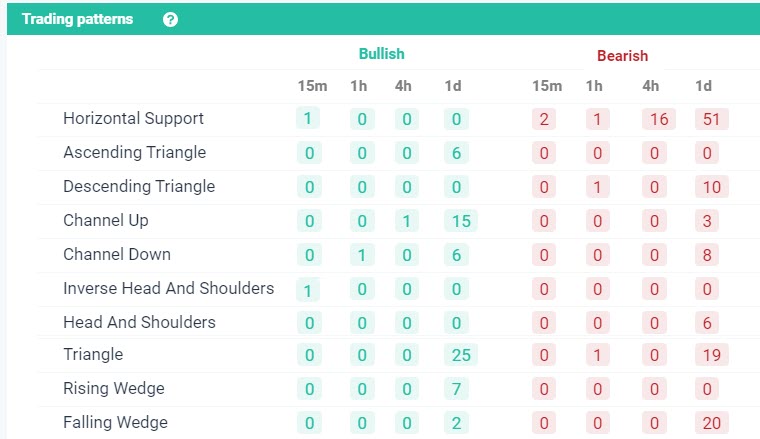
Our platform, altFINS, detects 26 pattern types across four time intervals (15m, 1h, 4h, 1d) for hundreds of assets, saving traders hours of manual chart scanning. Traders can easily monitor all trading signals in our Signals Summary section.
Custom Chart Pattern Filters
We teach trading Chart Patterns in Lesson 8 of our new Crypto Trading Course, which covers seven trading strategies, margin trading, short selling, and risk management. Additionally, our tutorial video on Custom Chart Pattern Filters provides a step-by-step guide to creating and utilizing these filters to enhance your trading strategies. Learn how to set up alerts here!
Understanding Chart Patterns
Chart patterns form due to buying and selling at certain price levels, causing price oscillations. When a price finally breaks out of the pattern, it indicates a significant change in sentiment. Our AI engine identifies 26 trading patterns across multiple time intervals, including:
- Ascending / Descending Triangle
- Head and Shoulders, Inverse Head and Shoulders
- Channel Up / Down
- Falling / Rising Wedge
- Double Bottom / Top
- Triple Bottom / Top
- Bullish / Bearish Flag
- Bullish / Bearish Pennant
- Rectangle
- Support / Resistance, among others.
Patterns for Beginners
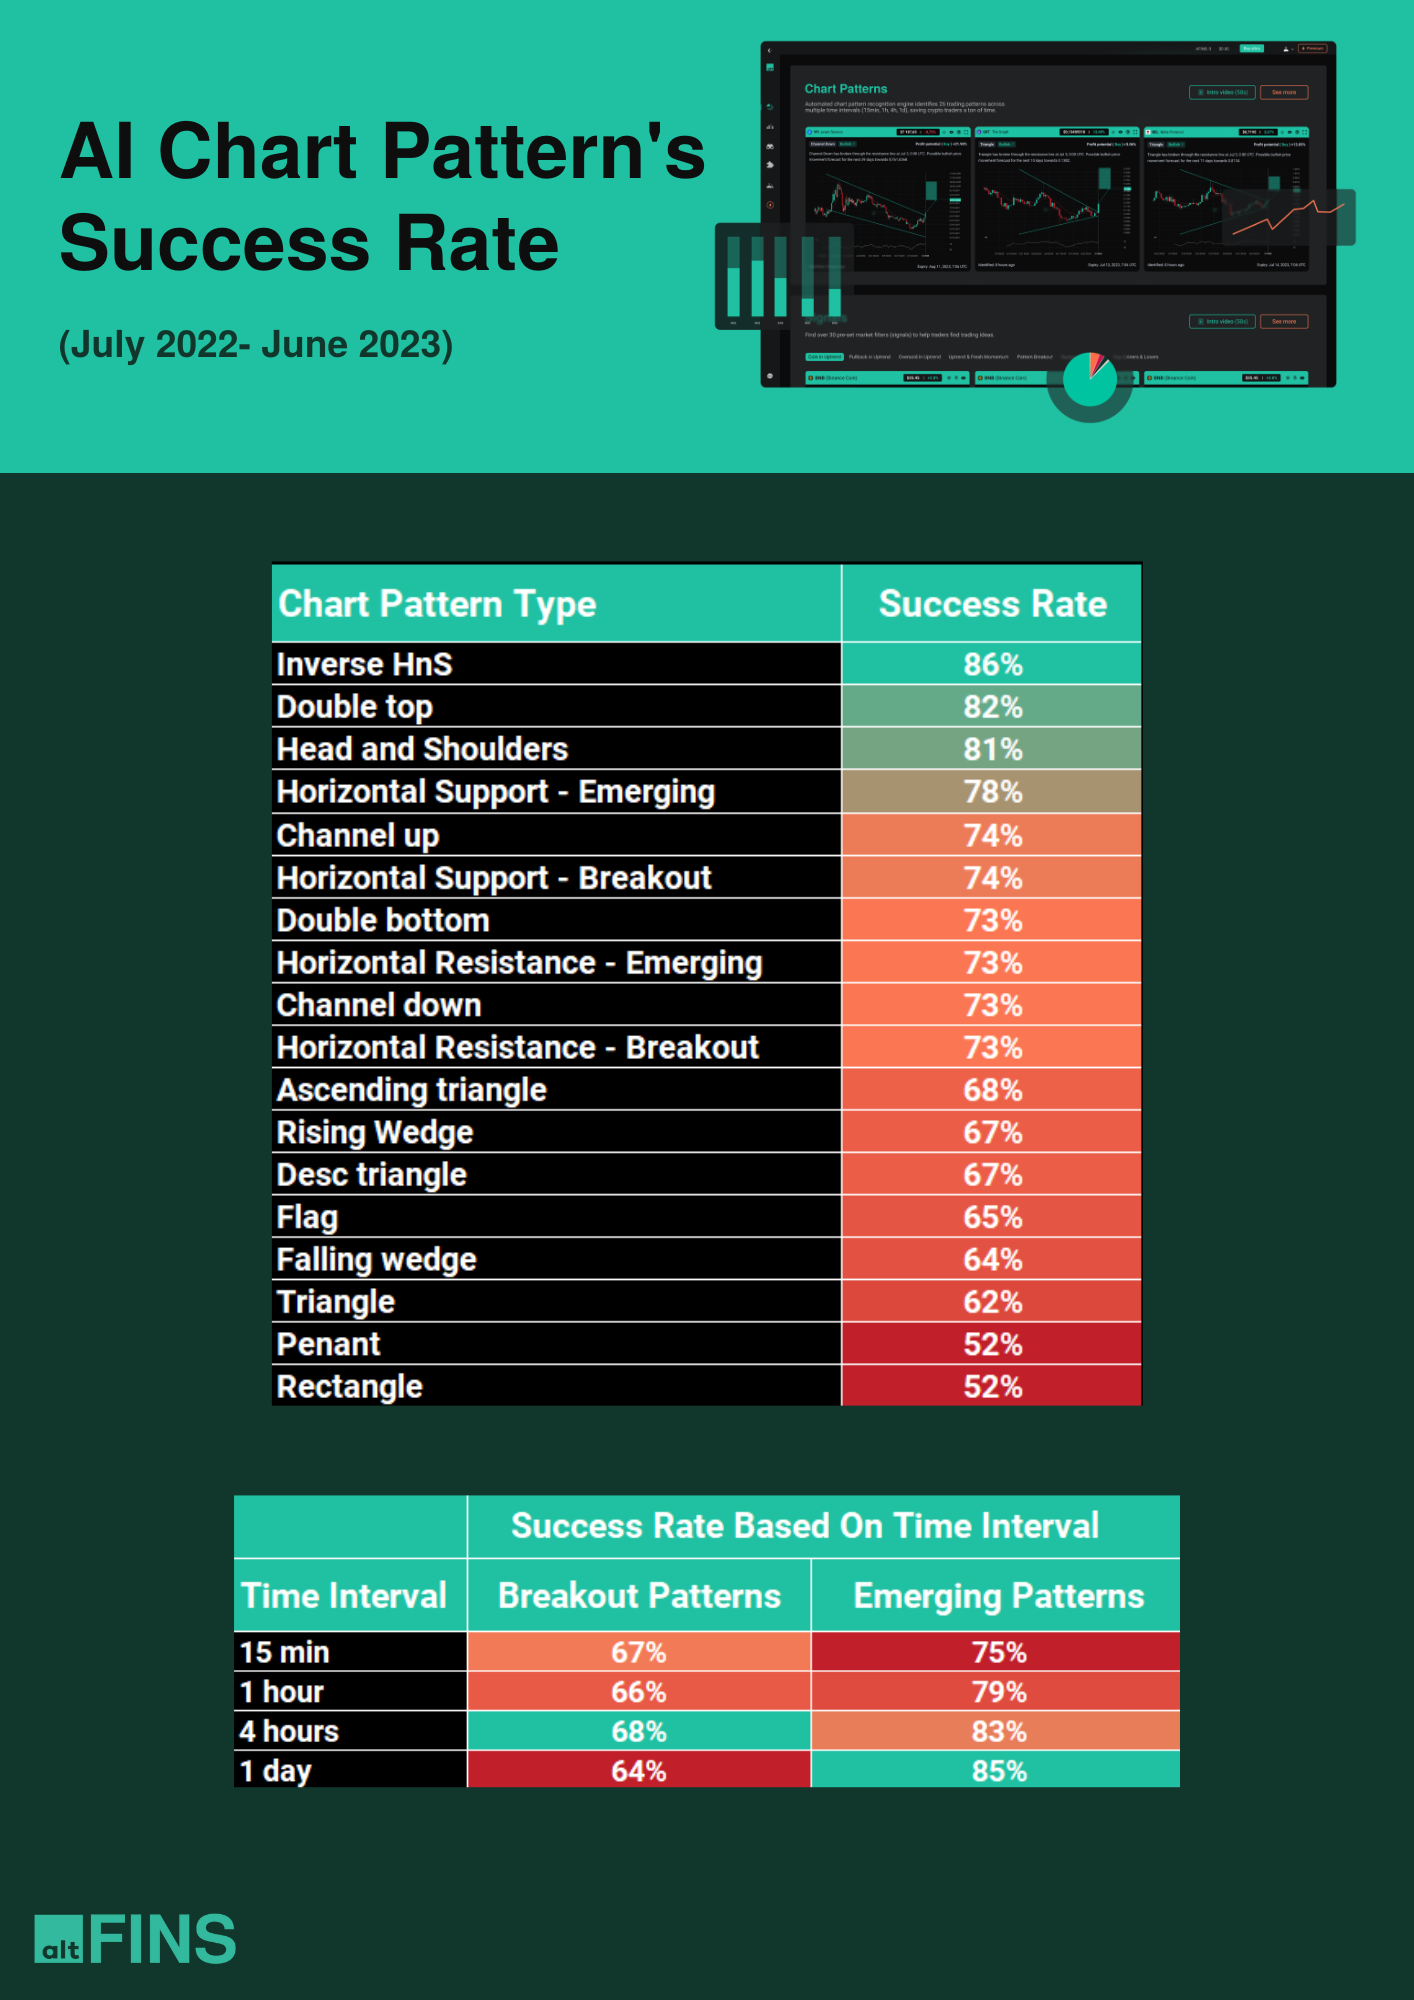
Beginners should start with the easiest and most successful patterns, such as Horizontal Resistance, Ascending Triangle, Channel Down, Falling Wedge, and Inverse Head and Shoulders, which have success rates of 67-83%. Learn more.
Watch our introduction video to understand our AI chart patterns better and how they can aid your trading strategies.
By leveraging our AI-based Chart Pattern recognition system, traders can efficiently identify and act on profitable market corrections, maximizing their trading potential even in downtrends. Upgrade your trading toolkit today and join our community of successful traders.
0 Comments
Leave a comment