


Gold Price Forecast: Is the Pullback a Buying Opportunity?

Gold has pulled back after a powerful rally, raising an important question for investors and traders: is this a healthy correction or the beginning of a deeper decline?
After breaking out of a Falling Wedge pattern, gold rallied approximately 15% and reached a three-month high near $4,700. The precious metal has since corrected roughly 5%, moving back toward the $4,350 support zone.
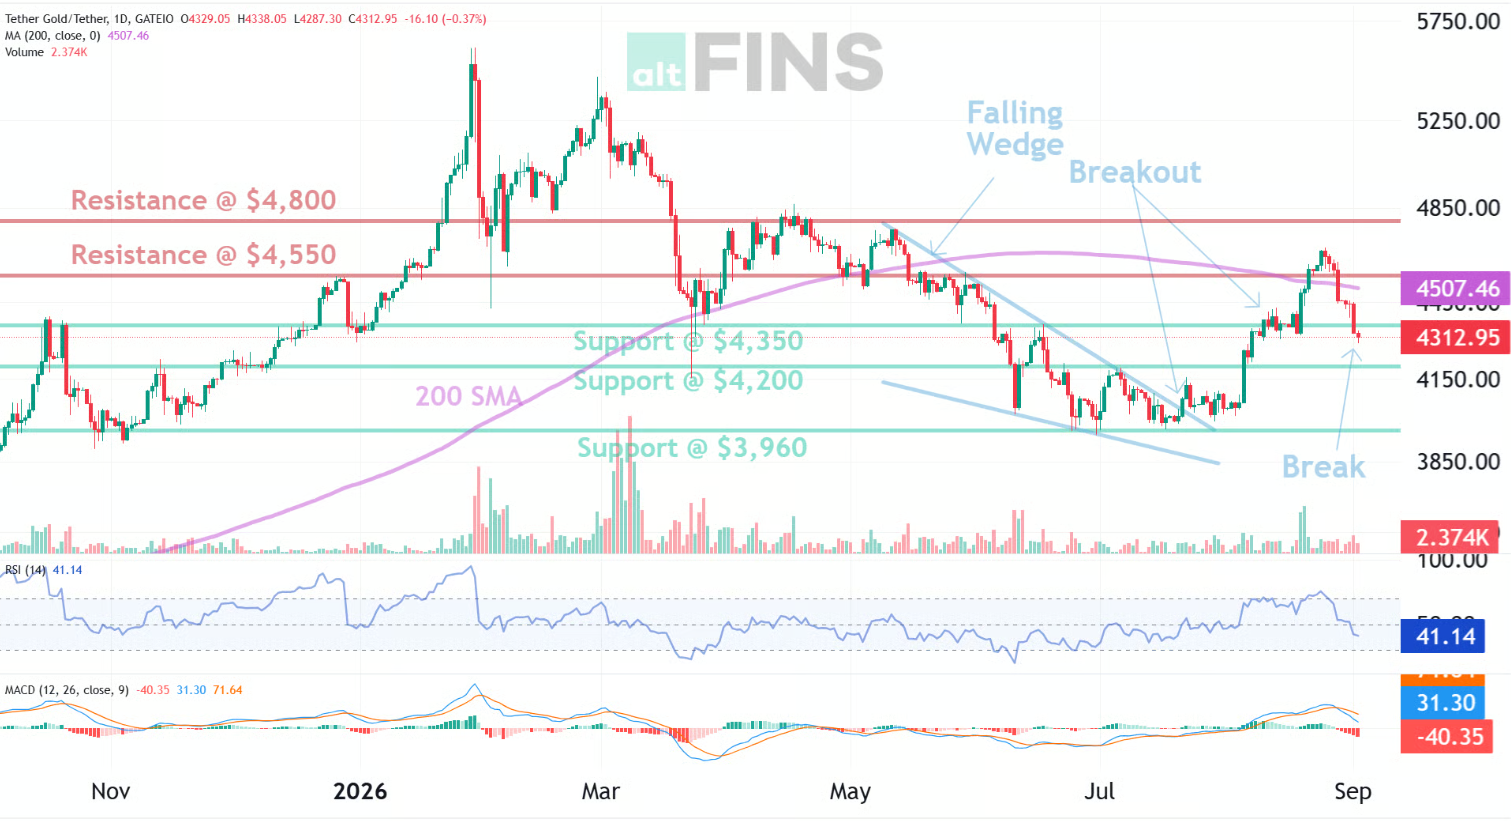
For now, the technical structure still looks more like a correction within a broader uptrend than a confirmed trend reversal.
Here’s what traders should watch next.
Gold Price Pullback: What Triggered the Correction?
The recent weakness in gold followed a shift in expectations around U.S. interest rates.
At Jackson Hole, Fed Chair Kevin Warsh took a hawkish stance, emphasizing persistent inflation pressures and the Federal Reserve’s commitment to its 2% inflation target.
Markets responded by increasing expectations for a September rate hike. The probability of a 25-basis-point hike rose to approximately 57%, compared with around 40% one week earlier.
Higher interest rates can weigh on gold because gold does not generate yield. When bond yields and interest-rate expectations rise, the opportunity cost of holding non-yielding assets increases.
A stronger U.S. dollar also added pressure to gold.
Rising oil prices contributed to the market’s concerns as well, adding another layer of inflation and geopolitical uncertainty.
The Rally Wasn’t Simply About ETF Inflows
An important factor behind the previous gold rally was the so-called “debasement trade.”
The August move was linked in large part to the U.S. Treasury increasing its long-bond buyback capacity following a weak 20-year Treasury auction.
That development contributed to concerns about currency debasement and supported demand for gold.
The current pullback can therefore partly be viewed as the market cooling after a sharp, sentiment-driven move higher.
Gold Technical Analysis: Key Levels to Watch
Gold is currently trading around a critical technical area.
The price has pulled back toward $4,350 support after failing near the $4,550 resistance zone.
The most important levels are:
- Support: $4,350
- Next support: $4,200
- Resistance: $4,550
- Next resistance: $4,800
- 200-day SMA: approximately $4,511
The 200-day moving average is currently acting as overhead resistance.
A successful move back above the 200-day SMA would therefore provide an early bullish signal and could strengthen the case for another attempt at $4,550 and eventually $4,800.
Conversely, a decisive break below $4,350 would weaken the current bullish setup.
Gold Price Forecast: Bullish Scenario
The bullish case is based on the idea that the longer-term uptrend remains intact despite the current correction.
If gold holds the $4,350 support level, buyers could step back in.
A reclaim of the 200-day SMA and $4,550 resistance would strengthen the bullish setup and potentially open the path toward $4,800.
Longer-term structural factors could also continue supporting gold, including central-bank demand, diversification away from the U.S. dollar and renewed ETF demand.
UBS expects gold to reach approximately $5,400 over the next 12 months, according to the analysis.
Under this scenario, the current pullback could represent a potential buy-the-dip opportunity rather than the end of the broader uptrend.
Gold Price Forecast: Bearish Scenario
The bearish scenario begins if gold loses its current support.
A sustained break below $4,350 would increase the probability of a deeper correction toward $4,200.
If $4,200 also fails, the next downside level to watch would be around $3,960.
A stronger U.S. dollar and increasing expectations for higher interest rates would add pressure to this scenario.
The key question is therefore whether buyers can defend $4,350.
Gold Price Levels to Watch
| Level | Type | Why It Matters |
|---|---|---|
| $4,800 | Resistance | Next major upside target |
| $4,550 | Resistance | Key breakout level |
| ~$4,511 | 200-day SMA | Important trend indicator |
| $4,350 | Support | Critical level for the current bullish setup |
| $4,200 | Support | Next downside target |
| $3,960 | Support | Deeper correction target |
AI Trade Setup for Gold
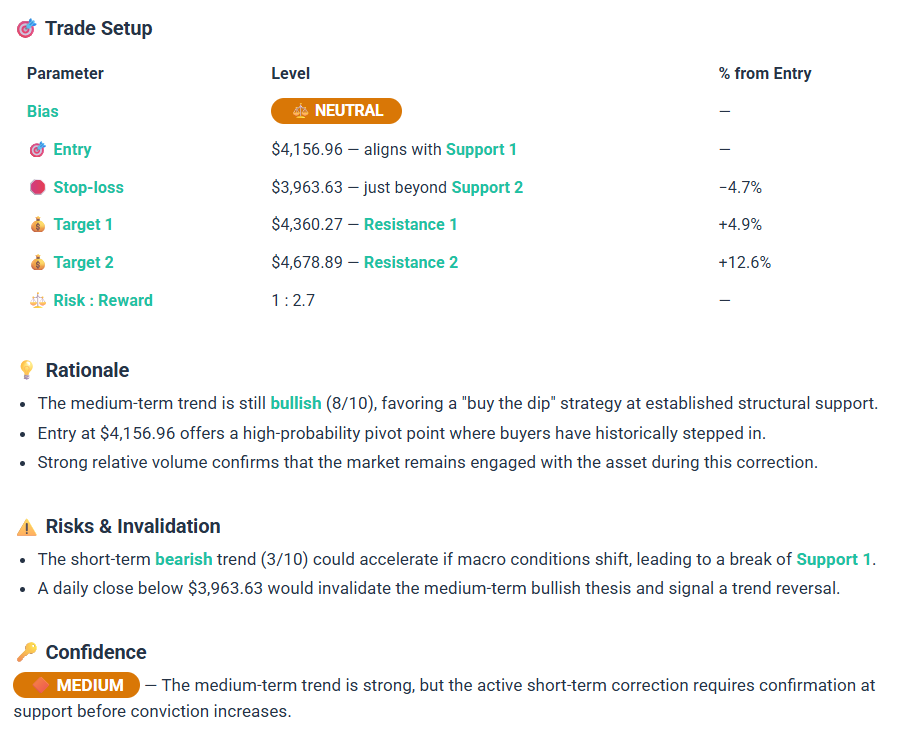
Technical analysis can help identify important levels, but traders still need to bring multiple signals together before making a decision.
That is where AI-powered trade analysis can help.
altFINS’ AI Trade Setup analyzes thousands of assets and generates a structured trade setup with a single click. The tool combines technical indicators, market structure and risk/reward considerations to help traders quickly identify potential opportunities.
The same approach can be applied across crypto markets, allowing traders to scan a large universe of assets instead of manually analyzing charts one by one.
[Explore AI Trade Setups →]
So, Is Gold a Buy After the Pullback?
The answer depends on how gold behaves around $4,350.
Bullish confirmation
A bullish setup becomes stronger if:
- Gold holds $4,350 support.
- Price reclaims the 200-day SMA.
- Gold breaks back above $4,550.
- Momentum returns toward $4,800.
Bearish confirmation
The outlook becomes more cautious if:
- Gold breaks decisively below $4,350.
- $4,200 support fails.
- The U.S. dollar continues strengthening.
- Interest-rate expectations move further toward higher-for-longer policy.
For now, $4,350 is the level to watch.
If it holds, the pullback could prove to be a normal correction within a larger uptrend. If it breaks, traders should prepare for a deeper retracement.
The key takeaway is simple: don’t focus only on whether gold is going up or down. Watch the levels that determine when the market structure changes.
Final Takeaway
Gold’s recent 5% pullback does not yet invalidate its broader bullish structure.
The precious metal remains at a critical technical crossroads, with $4,350 support and $4,550 resistance defining the near-term range.
A hold above support could create another opportunity for buyers, while a break below it could send gold toward $4,200 and potentially $3,960.
Rather than trying to predict every short-term move, traders can monitor these key levels and use technical signals to identify when the probability shifts from bullish to bearish — or vice versa.
Want to analyze gold and thousands of other assets using technical indicators and AI-powered trade setups? Explore altFINS Technical Analysis and AI Trade Setup tools.
 Written byLenka Fetyko
0 Comments
Leave a comment