Four Trading Strategies for Crypto Trade Entry

Richard Fetyko, CEO of altFINS:
“Finding the right trade entry during a pullback or correction can be a challenge for traders. But it’s a rewarding challenge because correct timing of the bottom can generate handsome profits, repeatedly. In today’s video, I explain 4+ ways to find the perfect entry on a pullback (dip).”
In June/July, the market was roaring, prices were breaking out of chart patterns, resistance levels, making new ATHs or new 52wk highs or at least new local highs, pullbacks were very brief.
So breakout strategies were great. Now market is correcting, few breakouts are occurring and if they do occur, they often don’t last for long or fail quickly.
So we need to focus on pullback strategies, finding the right entry points, support levels.
To find the dip opportunities, a trader can use various pre-set market scans available on altFINS’ Screener:
1. Pullback in Uptrend + support (see live scan results)
2. Uptrend & Mo Upswing + support (results)
3. Momentum & Uptrend (MACD xover) (results)
4. Uptrend & Oversold (results)
Bonus – use as confirmation, additional evidence of bottom:
- Bullish RSI Divergence
- Candlestick patterns – reversal patterns like Dragonfly, Hammer, Morning star, Bullish Engulfing
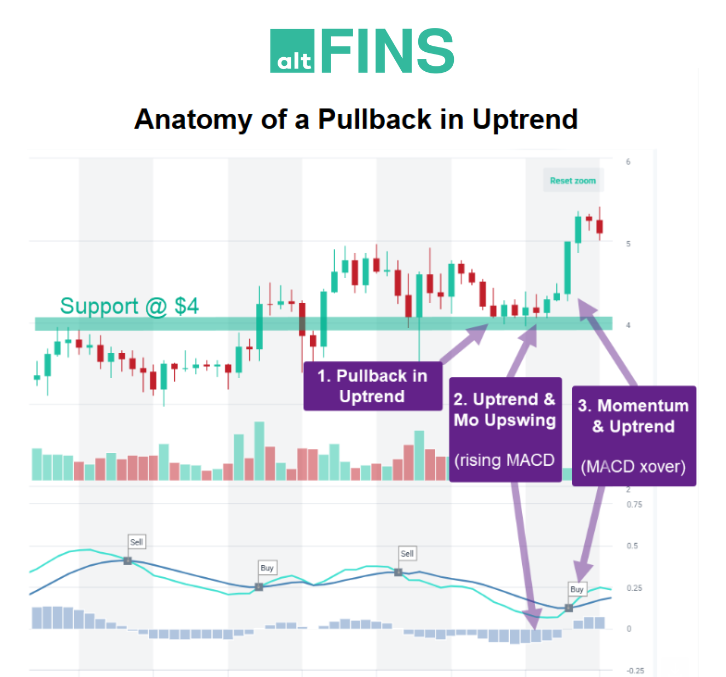
Anatomy of a Pullback in Uptrend
Notice in the above chart how different market scans identify trade entry opportunities at different stages of the pullback.
It’s up to the trader to pick which place to enter.
They all have their risks and benefits:
Using the (1) approach identifies trade entry early on in the pullback, which has the benefit of potentially capturing the full upswing (biggest profit).
It also has the benefit of capturing quick bounce up.
However, it also has the highest risk of failure, whereby the price keeps falling pass the initial support level (in this case $4). Then it feels like ‘catching a falling knife’.
Using (2) approach identifies trade entry a bit later than (1) approach. It waits for price to stabilize, as indicated by rising MACD Histogram indicator, which can indicate that buyers are stepping in. But it usually does not capture the full profit potential.
Using (3) approach identifies trade entry later than (1) and (2) approaches. It waits for price to actually bounce up (MACD Crossover) before a signal is generated.
That means that this (3) approach is safer, less prone to whipsaw, but also captures less upside (lower profit potential).
The last approach (4) is a special case whereby an asset sells off rapidly, which leads to an Oversold in Uptrend situation that often results in near-term bounce up.
I explain all of this in today’s trading video.


0 Comments
Leave a comment