Channel Down & Falling Wedge Breakouts: How to Spot Crypto Reversals Before They Happen

Published: April 4, 2026 | Reading Time: 10 min | By: altFINS Team Category: Chart Patterns · Beginner Guide
Many altcoins are consolidating in Channel Down and Falling Wedge patterns right now. Here’s how beginner traders can catch the breakout — with real examples showing +30% and +13% profits in a single day.
Key Stats at a Glance
- 73% — Channel Down Breakout Success Rate
- 64% — Falling Wedge Breakout Success Rate
- +30% — ALGO Breakout Profit (reached in 1 day)
- +13% — QTUM Breakout Profit (reached in 1 day)
Table of Contents
- What Are Channel Down & Falling Wedge Patterns?
- Why These Patterns Matter Right Now
- Channel Down vs. Falling Wedge: Key Differences
- Real Breakout Examples: ALGO (+30%) & QTUM (+13%)
- How to Trade These Breakouts (Step-by-Step)
- Risk Management for Beginners
- How to Find These Patterns on altFINS
- Frequently Asked Questions
1. What Are Channel Down & Falling Wedge Patterns?
If you’re new to crypto trading, chart patterns might sound intimidating — but they’re really just visual clues about where the market might go next. Two of the most powerful bullish reversal patterns are the Channel Down and the Falling Wedge.
Both patterns form during downtrends. Price makes a series of lower highs and lower lows, which looks bearish at first glance. But here’s the key insight: as the pattern develops, selling pressure is gradually being absorbed by buyers. At some point, demand overwhelms supply, and the price breaks out above the upper trendline — often with a rapid, profitable move upward.
Channel Down
A Channel Down consists of two parallel downward-sloping trendlines. The price bounces between these lines like a ball rolling down a ramp. The upper line connects the lower highs (resistance), and the lower line connects the lower lows (support). The distance between the two lines remains roughly constant throughout the pattern.
Falling Wedge
A Falling Wedge looks similar but has one critical difference: the two trendlines converge toward a point. This narrowing range means that each successive low is closer to the resistance line than the last — selling momentum is clearly fading. When the squeeze becomes too tight, the price breaks out, often explosively.
Key Takeaway: Both patterns signal that a downtrend is running out of steam. The breakout above the upper trendline is the buy signal. Don’t trade inside the pattern — wait for the breakout confirmation.
2. Why These Patterns Matter Right Now
Right now, many altcoins are consolidating within Channel Down and Falling Wedge formations. After extended sell-offs in earlier months, prices have compressed into these recognisable shapes. This is significant for two reasons.
First, consolidation precedes movement. Markets don’t stay compressed forever. The longer a pattern develops, the more explosive the eventual breakout tends to be. Traders who prepare in advance — setting alerts, defining entry and exit levels — position themselves to profit when the move happens.
Second, these patterns have strong historical track records. According to altFINS backtesting data, Channel Down breakouts succeed approximately 73% of the time, and Falling Wedge breakouts succeed about 64% of the time. No pattern works every time, but those odds are considerably better than coin-flipping.
3. Channel Down vs. Falling Wedge: Key Differences
| Feature | Channel Down | Falling Wedge |
|---|---|---|
| Trendlines | Parallel (equal distance) | Converging (narrowing) |
| Shape | Rectangle tilted downward | Narrowing cone pointing down |
| Success Rate | ~73% | ~64% |
| Signal Timing | Later (more confirmation) | Earlier (less confirmation) |
| Risk Level | Slightly lower | Slightly higher |
| Profit Target | Height of the channel | Widest part of the wedge |
| Best Timeframes | 4-hour and daily charts | 4-hour and daily charts |
The simplest way to remember the difference: if the trendlines are parallel, it’s a Channel Down. If they’re converging, it’s a Falling Wedge. Both are bullish when the price breaks above the upper line.
4. Real Breakout Examples: ALGO (+30%) & QTUM (+13%)
Let’s look at two recent real-world breakouts that hit their profit targets within a single day of the breakout signal.
ALGO (Algorand) — Channel Down Breakout → +30% Profit
ALGO had been trading within a clearly defined Channel Down pattern, making successive lower highs and lower lows between two parallel trendlines. When the price finally broke above the upper boundary, it surged rapidly — reaching a +30% gain from the breakout level within just one day. This breakout was identified by altFINS Technical Analysis.
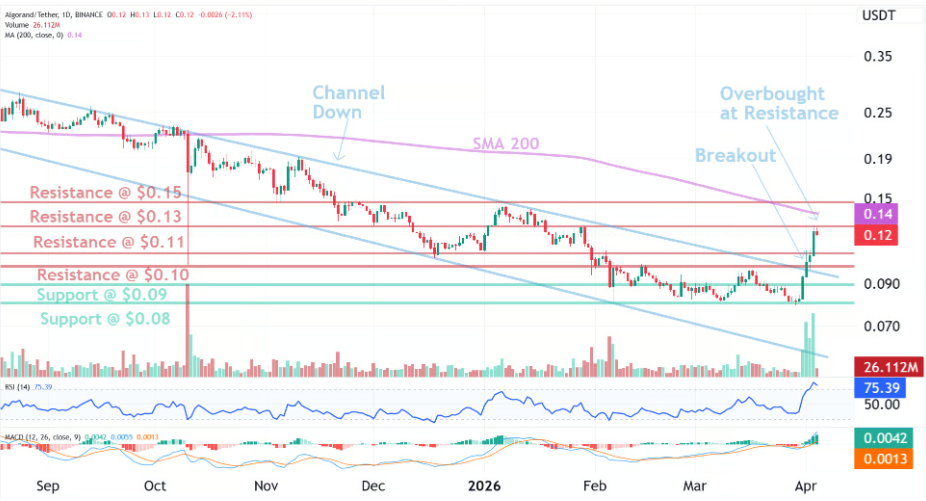
Source: altFINS Technical Analysis
QTUM — Falling Wedge Breakout → +13% Profit
QTUM formed a textbook Falling Wedge pattern with converging downward trendlines. As the wedge narrowed, selling volume decreased — a classic sign that selling pressure was exhausting itself. The breakout above the upper trendline delivered +13% profit within one day, detected by altFINS AI Chart Patterns recognition engine.
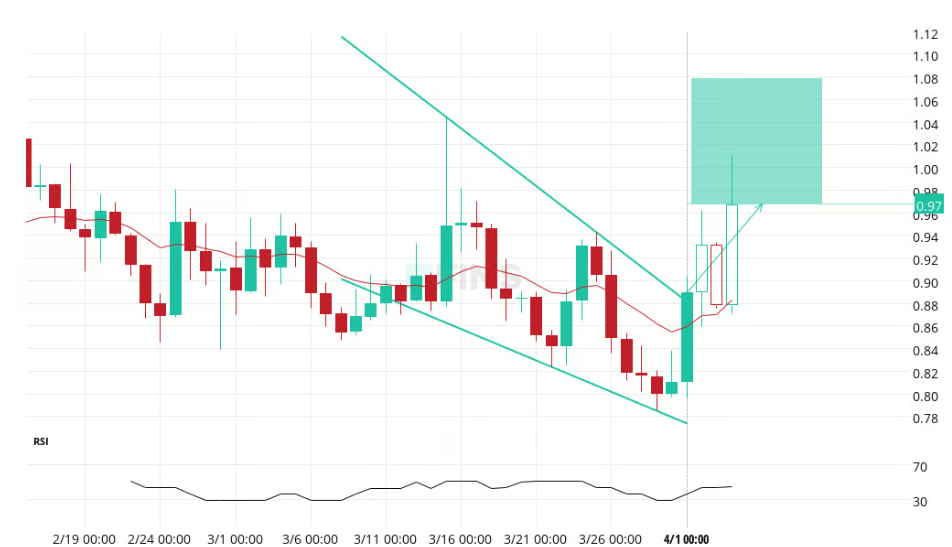
Source: altFINS AI Chart Patterns
These examples show why preparation matters. If you spot the pattern forming before the breakout, you’re ready to act when the signal triggers — instead of chasing the move after it’s already happened.
5. How to Trade These Breakouts (Step-by-Step)
Here is a straightforward process that beginners can follow:
Step 1: Identify the pattern. Look for price moving between two downward-sloping trendlines. Connect at least two (ideally three) lower highs and lower lows. Determine whether the lines are parallel (Channel Down) or converging (Falling Wedge).
Step 2: Wait for the breakout candle. Patience is essential. Do not enter while the price is still inside the pattern. A valid breakout occurs when a candle closes above the upper trendline — not just pokes above it intraday.
Step 3: Confirm with volume. A genuine breakout is typically accompanied by a noticeable increase in trading volume. If volume is flat or declining during the breakout, treat it with extra caution — it may be a false breakout (also called a “fakeout”).
Step 4: Enter the trade. Place your buy order after the breakout candle has closed above the trendline. Some conservative traders wait for a retest — where the price pulls back to the broken trendline (which now acts as support) before continuing higher.
Step 5: Set your stop-loss. Place a stop-loss just below the most recent swing low inside the pattern. This limits your downside if the breakout fails. For crypto, leave a small buffer for volatility.
Step 6: Set your profit target. Measure the height of the pattern at its widest point — from the upper trendline down to the lower trendline. Then project that distance upward from the breakout point. That’s your minimum target. Aim for at least a 2:1 reward-to-risk ratio.
Pro Tip: Set Alerts. Don’t stare at charts all day waiting for a breakout. Use the altFINS mobile app to create price alerts on coins forming these patterns. You’ll get a notification the moment a breakout triggers — so you can act fast from anywhere. Here’s how to set up price alerts.
6. Risk Management for Beginners
Even with a 73% success rate, roughly one in four Channel Down breakouts will fail. For Falling Wedges, about one in three won’t reach their target. Risk management is what keeps you in the game long enough to profit from the winners. Here are the essentials.
Never risk more than 1–2% of your total portfolio on a single trade. If your trading account is $1,000, your maximum loss per trade should be $10–$20. This means sizing your position so that if your stop-loss is hit, you lose no more than that amount.
Always use a stop-loss. A breakout can reverse quickly. Place your stop below the last swing low in the pattern, and do not move it further away once the trade is open. Some platforms let you set a trailing stop, which locks in profits as the price moves in your favour.
Take partial profits at your target. When the price reaches your calculated target, consider closing 50–75% of your position and letting the rest ride with a trailing stop. This locks in gains while giving you exposure to larger moves.
Avoid over-leveraging. Leverage amplifies both gains and losses. As a beginner, trade with spot positions or very low leverage (2x maximum) until you are consistently profitable.
7. How to Find These Patterns on altFINS
Scanning hundreds of crypto charts manually is time-consuming and error-prone. The altFINS platform uses AI-powered chart pattern recognition to identify Channel Down and Falling Wedge patterns automatically across thousands of coins and multiple timeframes (15-minute, 1-hour, 4-hour, and daily).
There are three ways to find these patterns on the platform:
Signals Summary: Head to the Signals Summary page and check the Patterns section. This gives you a quick overview of all current breakout signals, including Channel Down and Falling Wedge patterns, sorted by recency and profit potential.
Chart Patterns: Use the dedicated Chart Patterns tool. Filter by pattern type (select “Channel Down” or “Falling Wedge”), then sort by success rate, profit potential, exchange, or direction. You can also filter for breakout-stage patterns only.
Technical Analysis: The Technical Analysis section provides detailed trade setups for 50+ major altcoins, including take-profit and stop-loss levels calculated by altFINS analysts. Search for Channel Down and Falling Wedge setups here for professional-grade trade plans.
Never Miss a Signal: Set up custom alerts for any chart pattern on the altFINS platform and get instant notifications on your phone. Here’s how to set up price alerts.
Ready to Catch the Next Breakout?
Join altFINS and let AI scan thousands of crypto charts for Channel Down, Falling Wedge, and 24 other chart patterns — so you don’t have to.
8. Frequently Asked Questions
What is a Channel Down pattern in crypto?
A Channel Down is a bearish chart pattern where price trades between two parallel downward-sloping trendlines, forming lower highs and lower lows. When the price breaks above the upper trendline, it signals a potential bullish reversal. Historical data shows Channel Down breakouts have a 73% success rate in crypto markets.
What is a Falling Wedge pattern in crypto?
A Falling Wedge is a bullish reversal pattern formed by two downward-sloping trendlines that converge toward a point. Unlike a Channel Down (parallel lines), the wedge narrows over time, indicating fading selling pressure. A breakout above the upper trendline typically signals the start of an uptrend. Falling Wedge breakouts have a historical success rate of approximately 64%.
How do you trade a Channel Down breakout?
Identify the pattern with two parallel downward trendlines, then wait for a candle to close above the upper trendline. Confirm the breakout with increased volume. Enter the trade after confirmation, set a stop-loss below the last swing low in the pattern, and set a profit target equal to the channel’s height projected upward from the breakout point.
What is the difference between a Channel Down and a Falling Wedge?
The key difference is the shape of the trendlines. A Channel Down has parallel trendlines (equal distance apart), while a Falling Wedge has converging trendlines that narrow toward a point. Both are bullish reversal patterns, but Channel Down breakouts have a higher historical success rate (73% vs. 64%). Falling Wedges tend to signal earlier but carry slightly more risk of false breakouts.
How reliable are crypto chart pattern breakouts?
Reliability varies by pattern. According to altFINS historical data, Channel Down breakouts succeed about 73% of the time and Falling Wedge breakouts about 64%. No pattern is 100% reliable — always use stop-losses and proper position sizing to manage risk. Combine pattern signals with volume confirmation and broader trend analysis for the best results.
How can I find altcoins with these patterns right now?
The fastest way is using the altFINS platform, which uses AI-powered chart pattern recognition to scan thousands of coins across multiple timeframes. Check the Signals Summary (Patterns section), the Chart Patterns filter (select Channel Down or Falling Wedge), or the Technical Analysis section for detailed trade setups with entry, stop-loss, and profit target levels.


0 Comments
Leave a comment