BTC makes another failed attempt at $20K; TA review of MKR, ZEC, VET, ETC, THETA
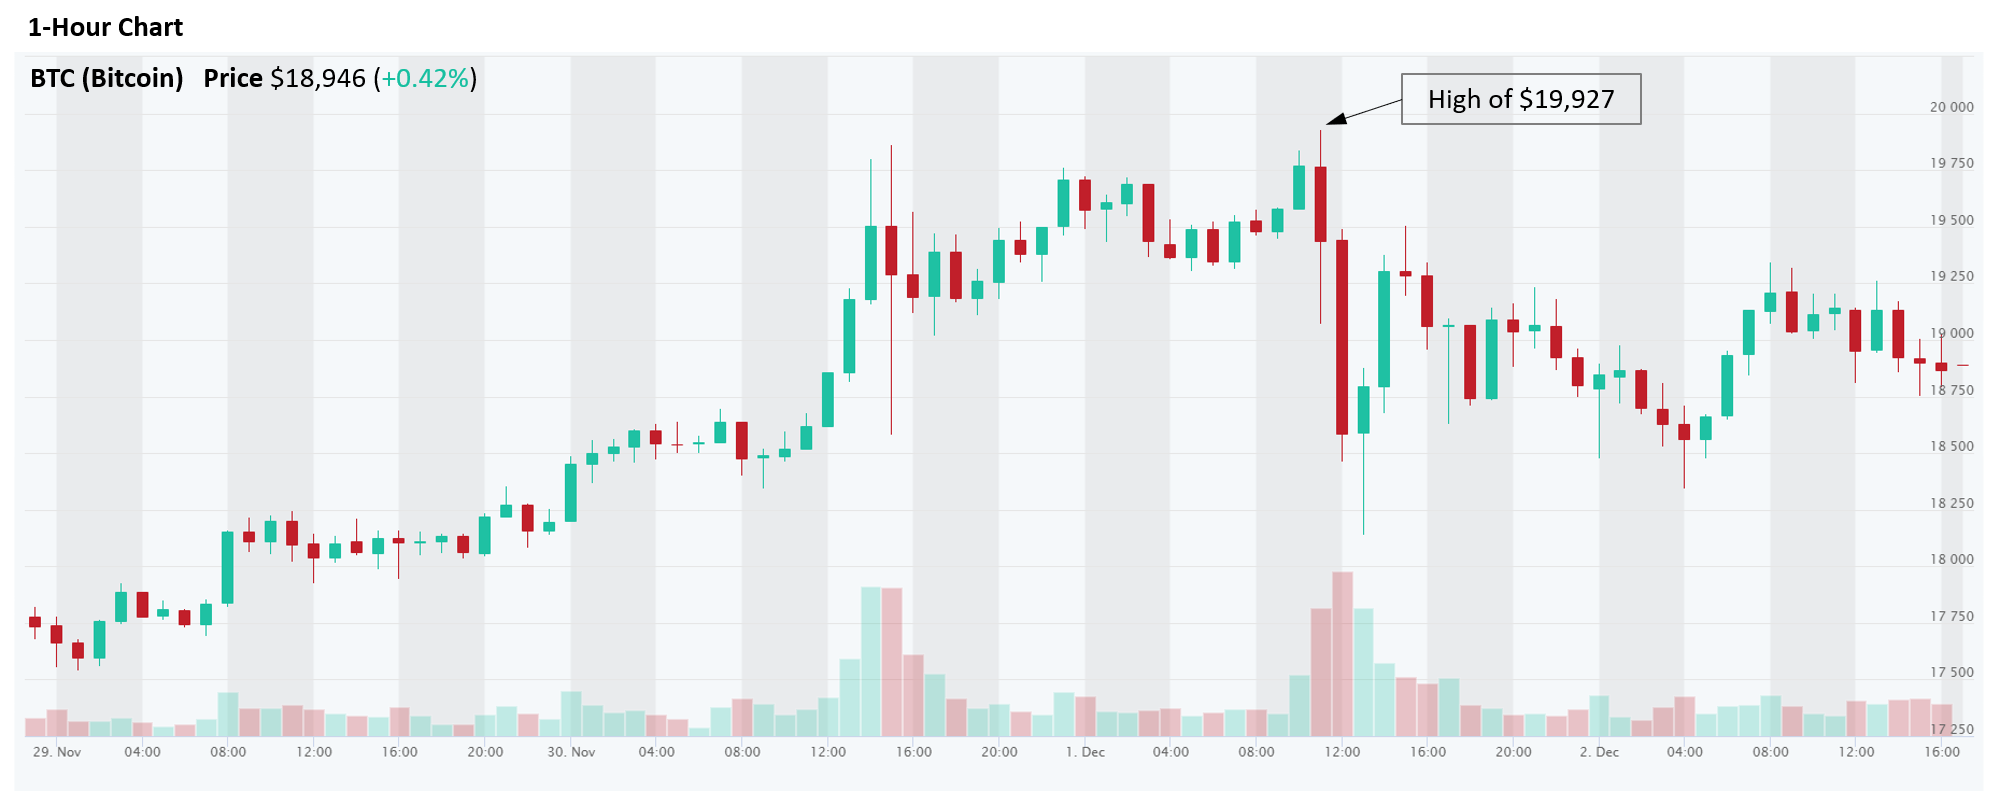
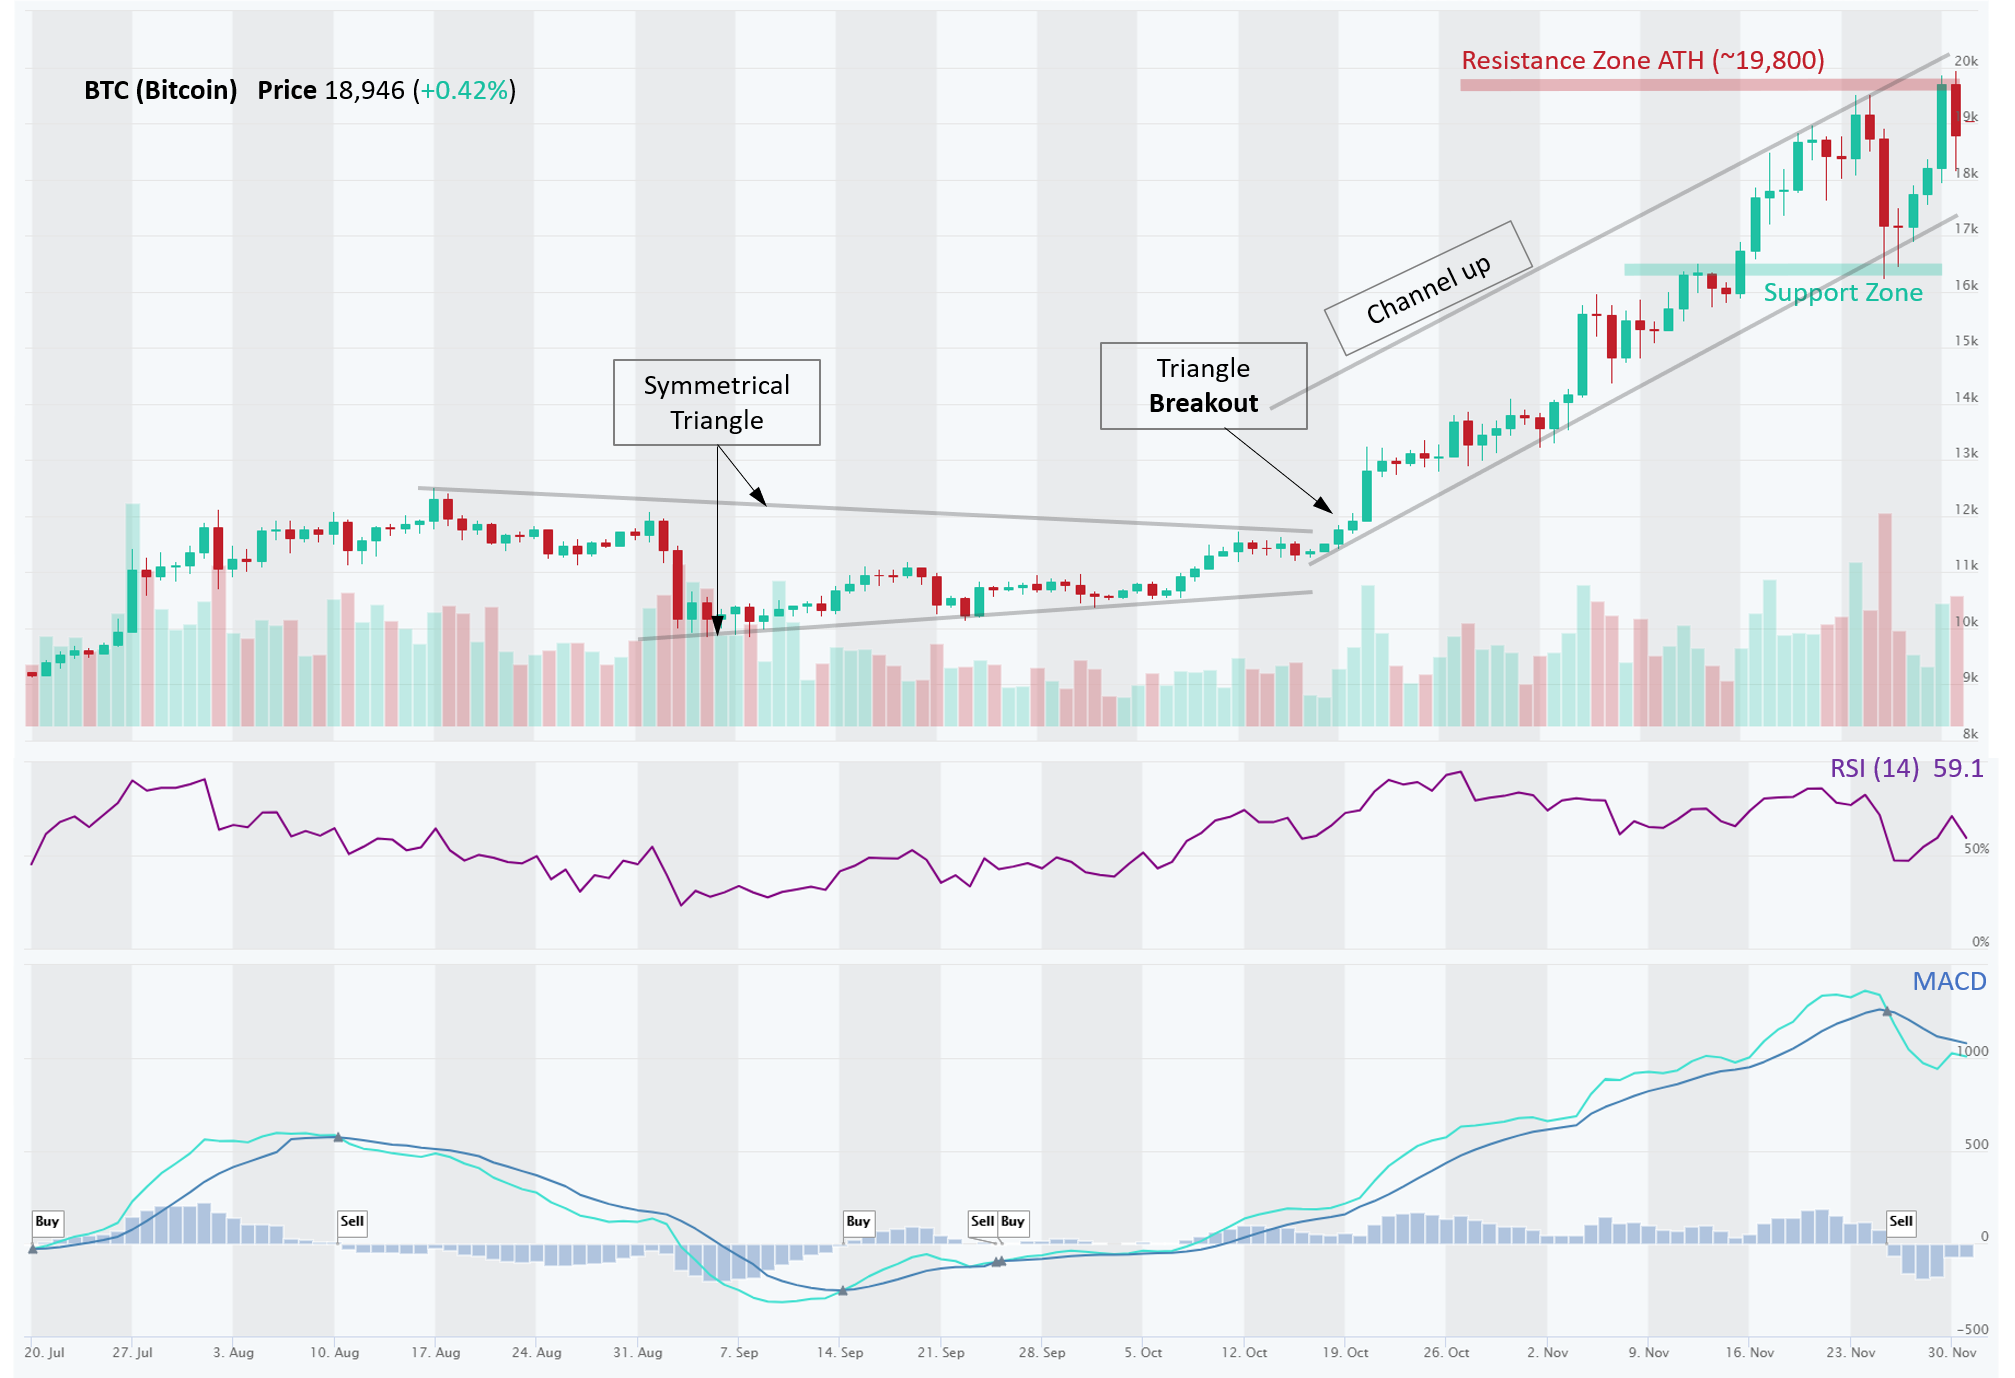
Yesterday (see hourly chart below), Bitcoin (BTC) made another failed attempt to break through $20K and it was decisively rejected (two big volume down candles). This was the second attempt following the first approach on Nov 24, after which price cratered 15% to $16,200 on big volume. The second rejection could result in a bearish Double Top pattern (on a daily chart below), which would indicate a reversal or at least a pause in the near-term trend. A Triple Top would be even a stronger trading signal, if BTC makes another failed attempt to break through the strong $20K Resistance area.
With increased volatility, we are forced to frequently update our technical analysis (TA). Here’s an update on MKR, ZEC, VET, ETC, THETA.
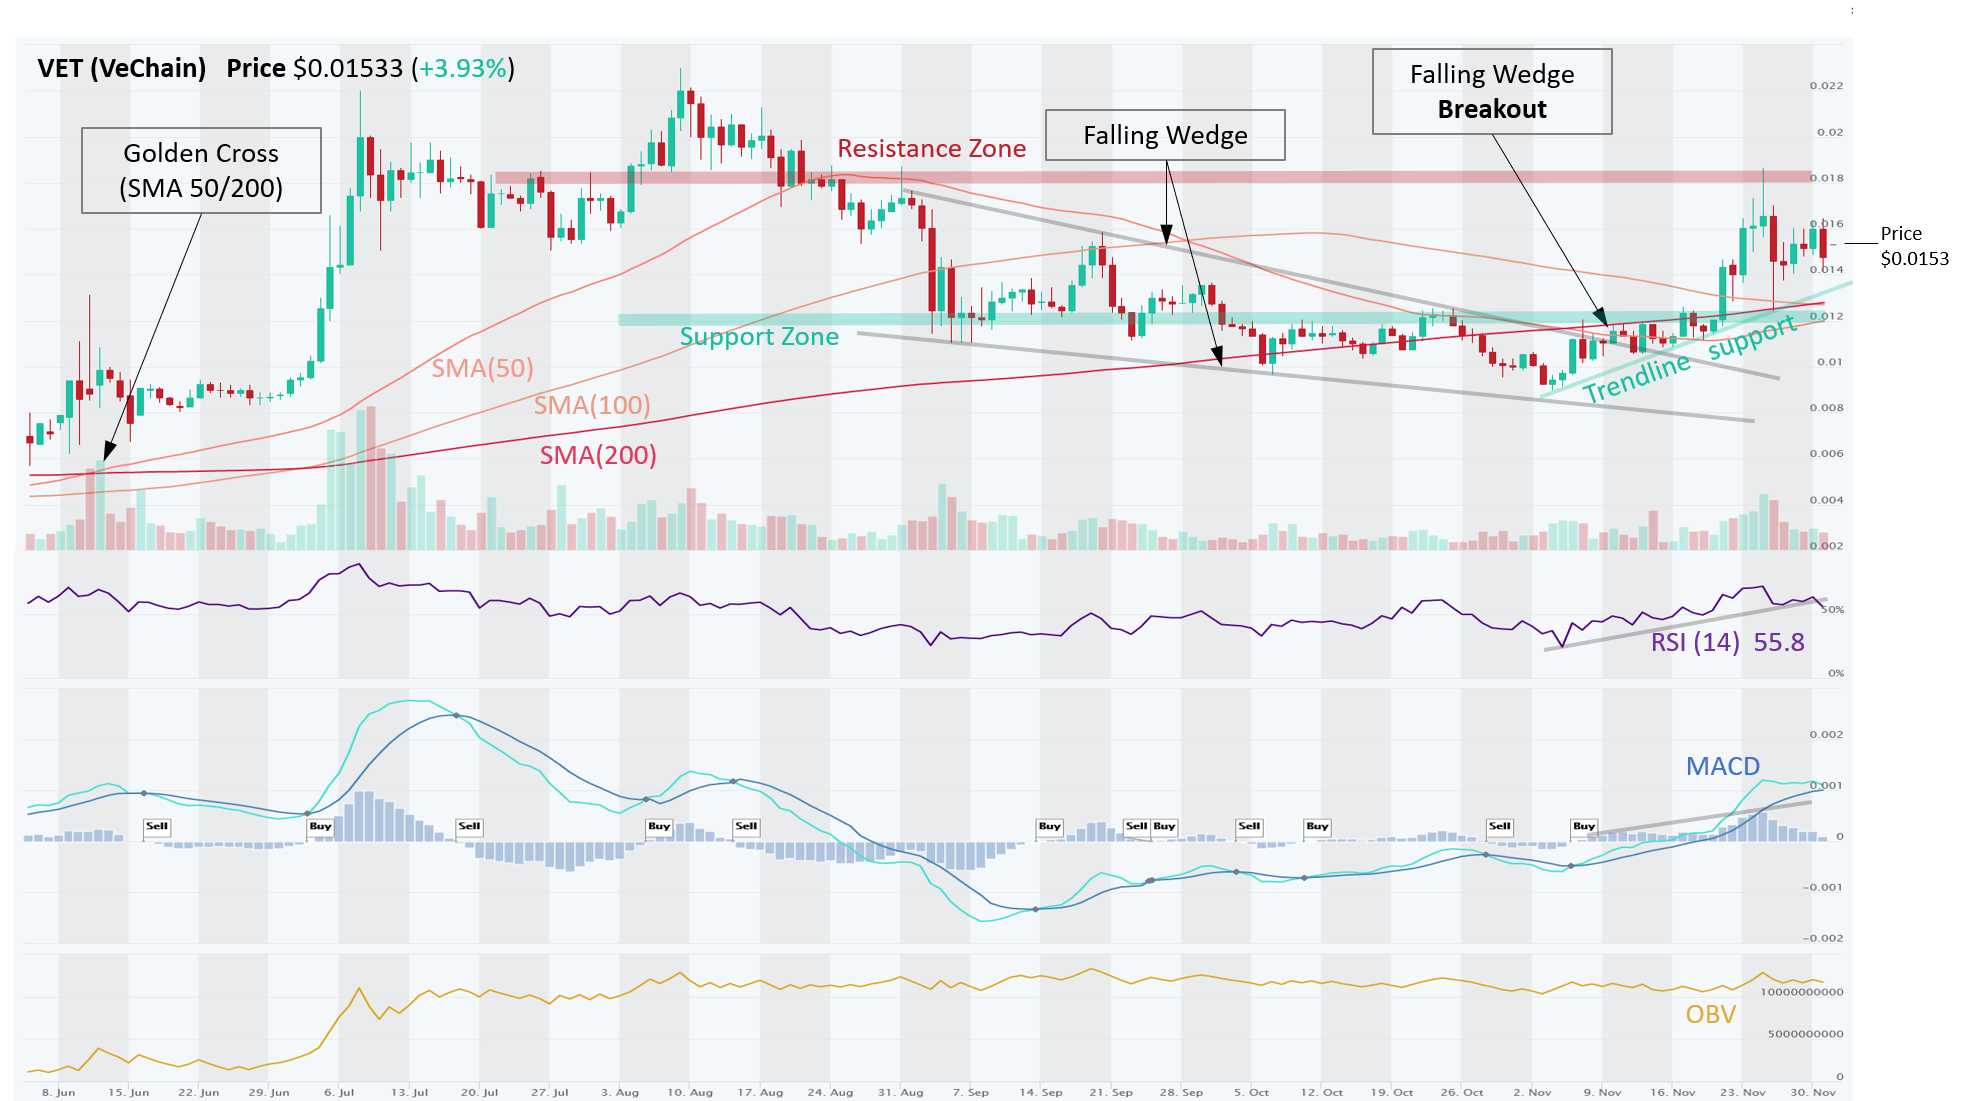
VET – Price Reversed Upwards Following a Falling Wedge Breakout
VET (VeChain) is in an Uptrend on a Short- and Medium-Term basis, while Long-Term is still in a Downtrend. During September and October, price formed a Falling Wedge, which is a bullish reversal pattern formed by connecting the lower highs and lower lows. It is also typically accompanied by declining volumes, as was the case here. In a Falling Wedge pattern, price starts to trade sideways in more of a consolidation pattern before reversing sharply higher. It did just that in mid-November when the price broke out of the pattern, clearing the formidable $0.012 Resistance and 200 Day SMA. Both of which have now become a solid Support Zone.
Momentum has diminished recently, although still bullish (MACD Crossover, RSI > 50). OBV (volume on Up days vs Down days) is in a slight uptrend, showing solid demand from buyers. ADX is between 20-40 but declining modestly, indicating that the Uptrend is losing some steam. Price is likely to oscillate between Support zone at ~ $0.012 and overhead Resistance Zone at ~ $0.018. Admittedly, a very wide range for now.
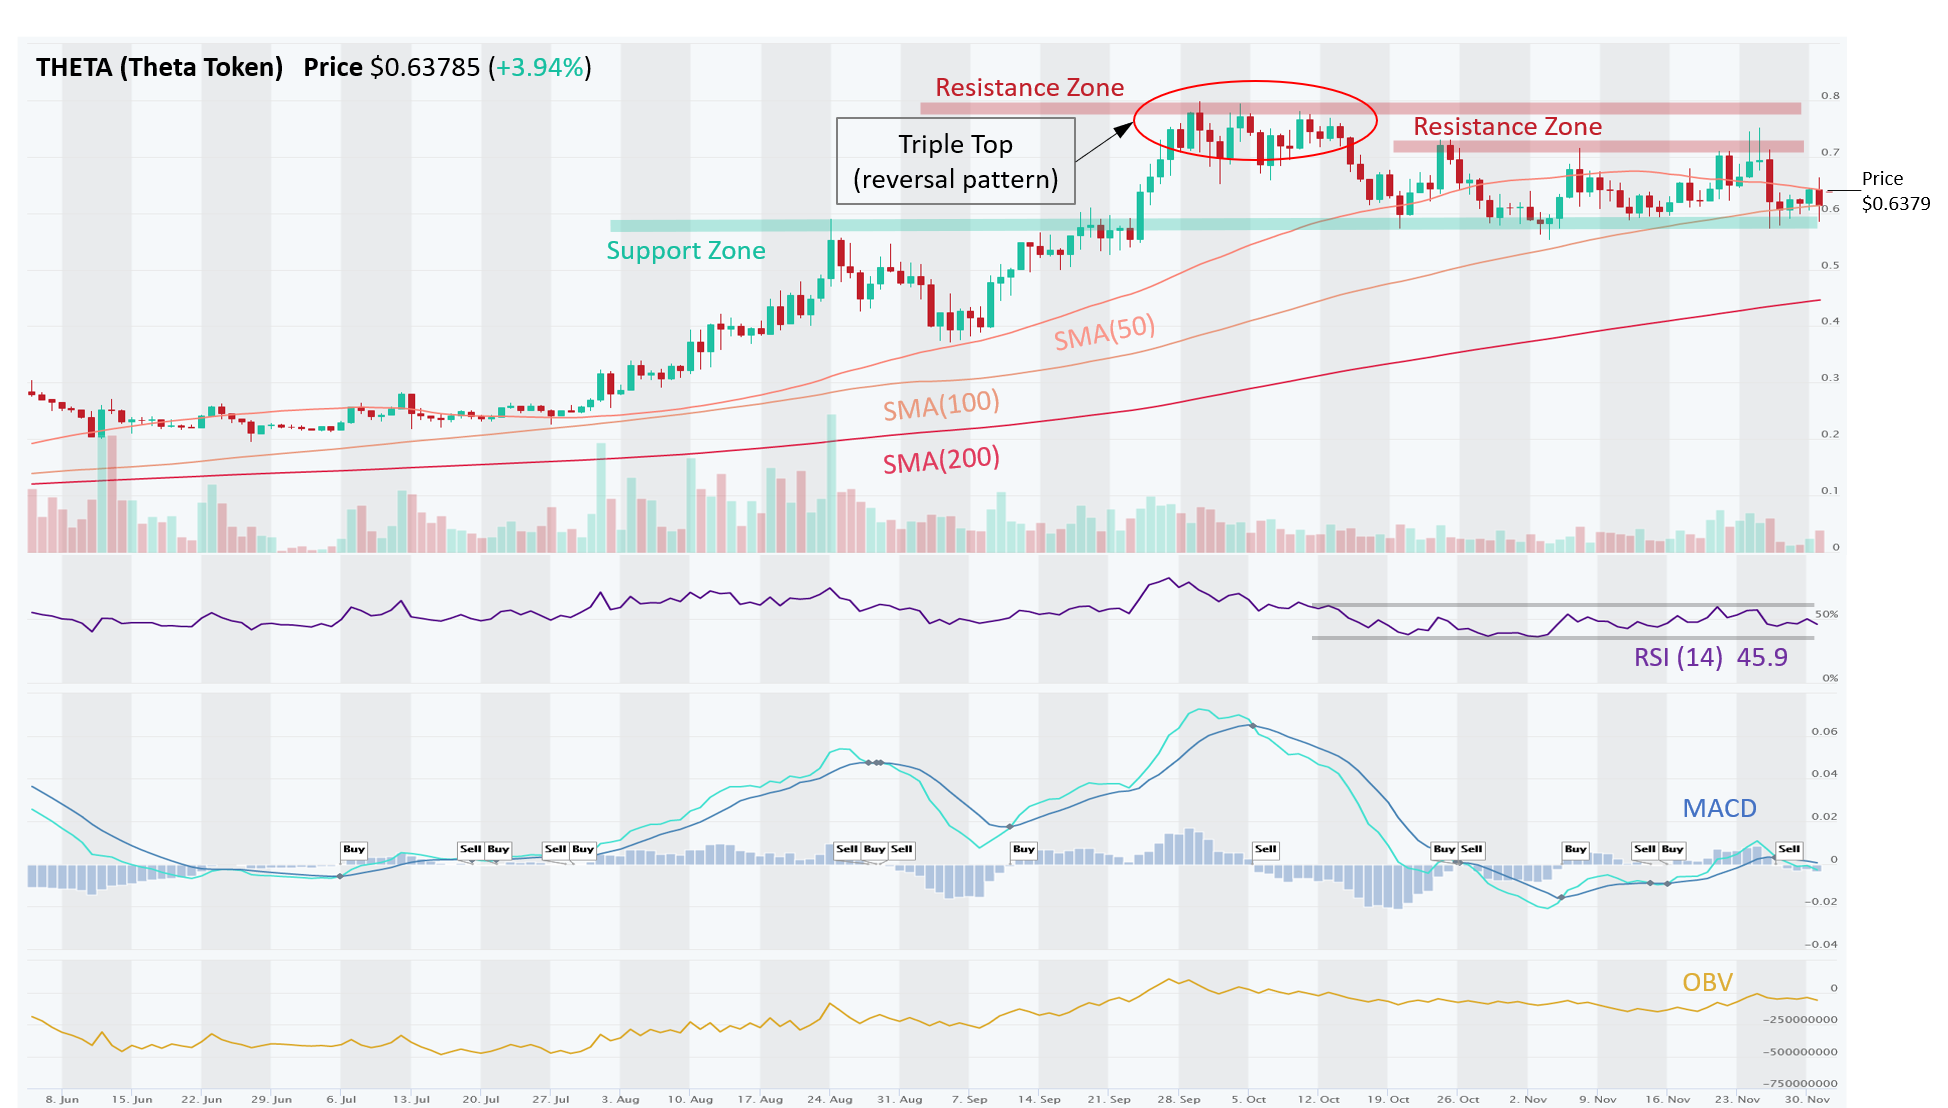
THETA – After a Huge Uptrend, a Triple Top Reversal Pattern Grounded the Price into a Sideways Trading Channel
THETA (Theta Token) is in an Uptrend across all time horizons (Short-, Medium-, Long-Term), however, following major gains (~100%) in September, the price hit a resistance and formed a Triple Top reversal pattern (too many sellers at $0.80 level). Since then, it has been consolidating in a sideways trading Channel between a solid Support Zone at ~ $0.575 and Resistance Zone at ~ $0.700. This Channel can be traded (Buy Support, Sell Resistance), or traders could wait for a decisive breakout (ideally confirmed by big volume), either Up or Down. Momentum (MACD, RSI) is uninspiring currently and OBV has flatlined as well. ADX is below 20, which signals weak trend and it is declining, which suggests that price could be stuck in a range a bit longer.
ETC – Falling Wedge Nearing a Pinnacle (Breakout), Could be a Reversal of Downtrend
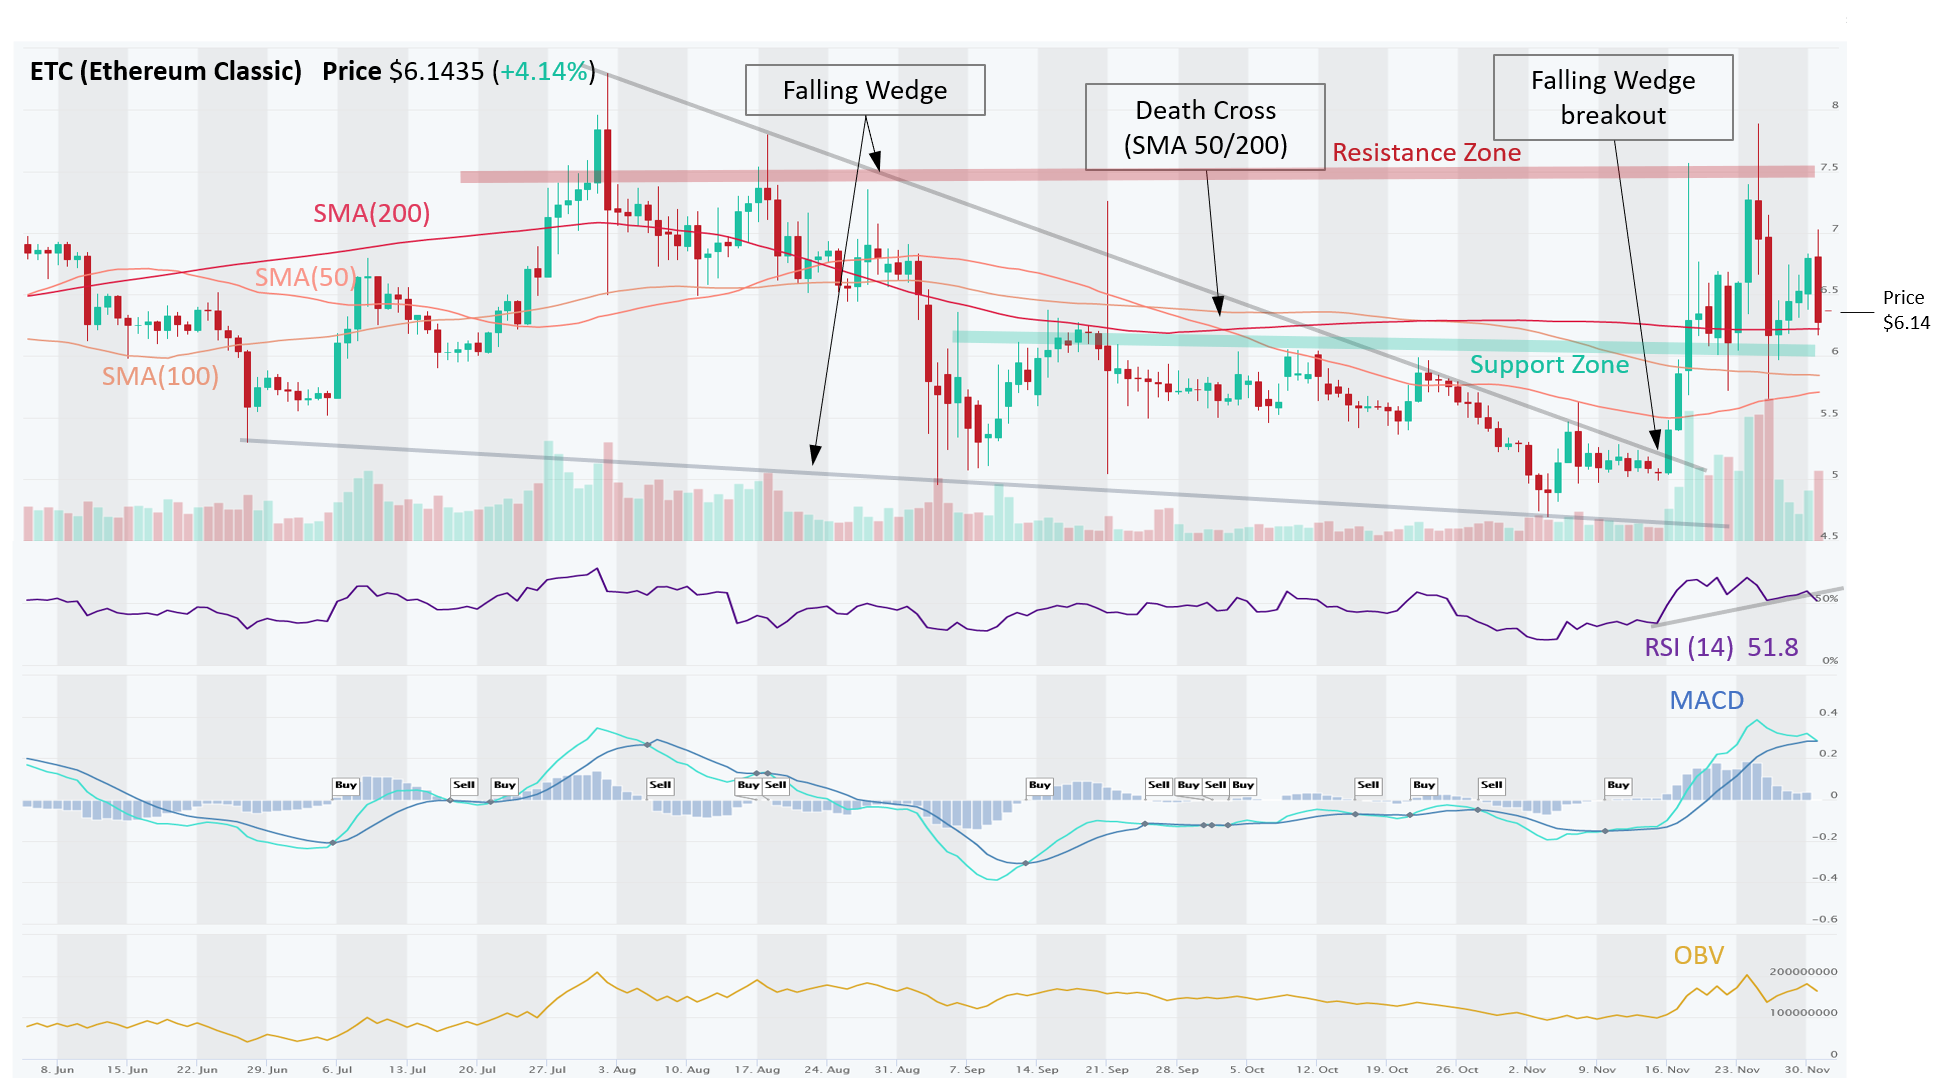
ETC (Ethereum Classic) is in an Uptrend on a Short- and Medium-Term basis, although still in a Downtrend on a Long-Term basis. However, recent price action has done a lot of repairs to SMAs and trends. Ethereum Classic blockchain suffered three 51% attacks in August. First attack was on August 1, which marked the beginning of a downtrend. The blockchain implemented a defense mechanism on October 13.
The price then formed a Falling Wedge, which is a bullish reversal pattern formed by connecting the lower highs and lower lows. It is also typically accompanied by declining volumes, as was the case here. In a Falling Wedge pattern, price starts to trade sideways in more of a consolidation pattern before reversing higher. Indeed, on Nov 16, price broke upward from the Falling Wedge, confirmed by big volume, and quickly cleared the $5.50 and $6.00 Resistance areas, which have now become Support Zones. Reinforcing the $6.00 Support Zone is the 200 Day SMA. Hence, for traders bullish on ETC, this could be a good level to get involved.
Price is likely to consolidate here before making further advances towards the $7.50 Resistance Zone. Momentum has diminished (MACD and RSI weakening) and OBV flatlining again (volume on Up days vs Down days), indicating relative balance between buyers and sellers. ADX of is between 20-40 and rising, signaling a strong trend.
ZEC – Successful Breakout from Descending Triangle Established a New Uptrend
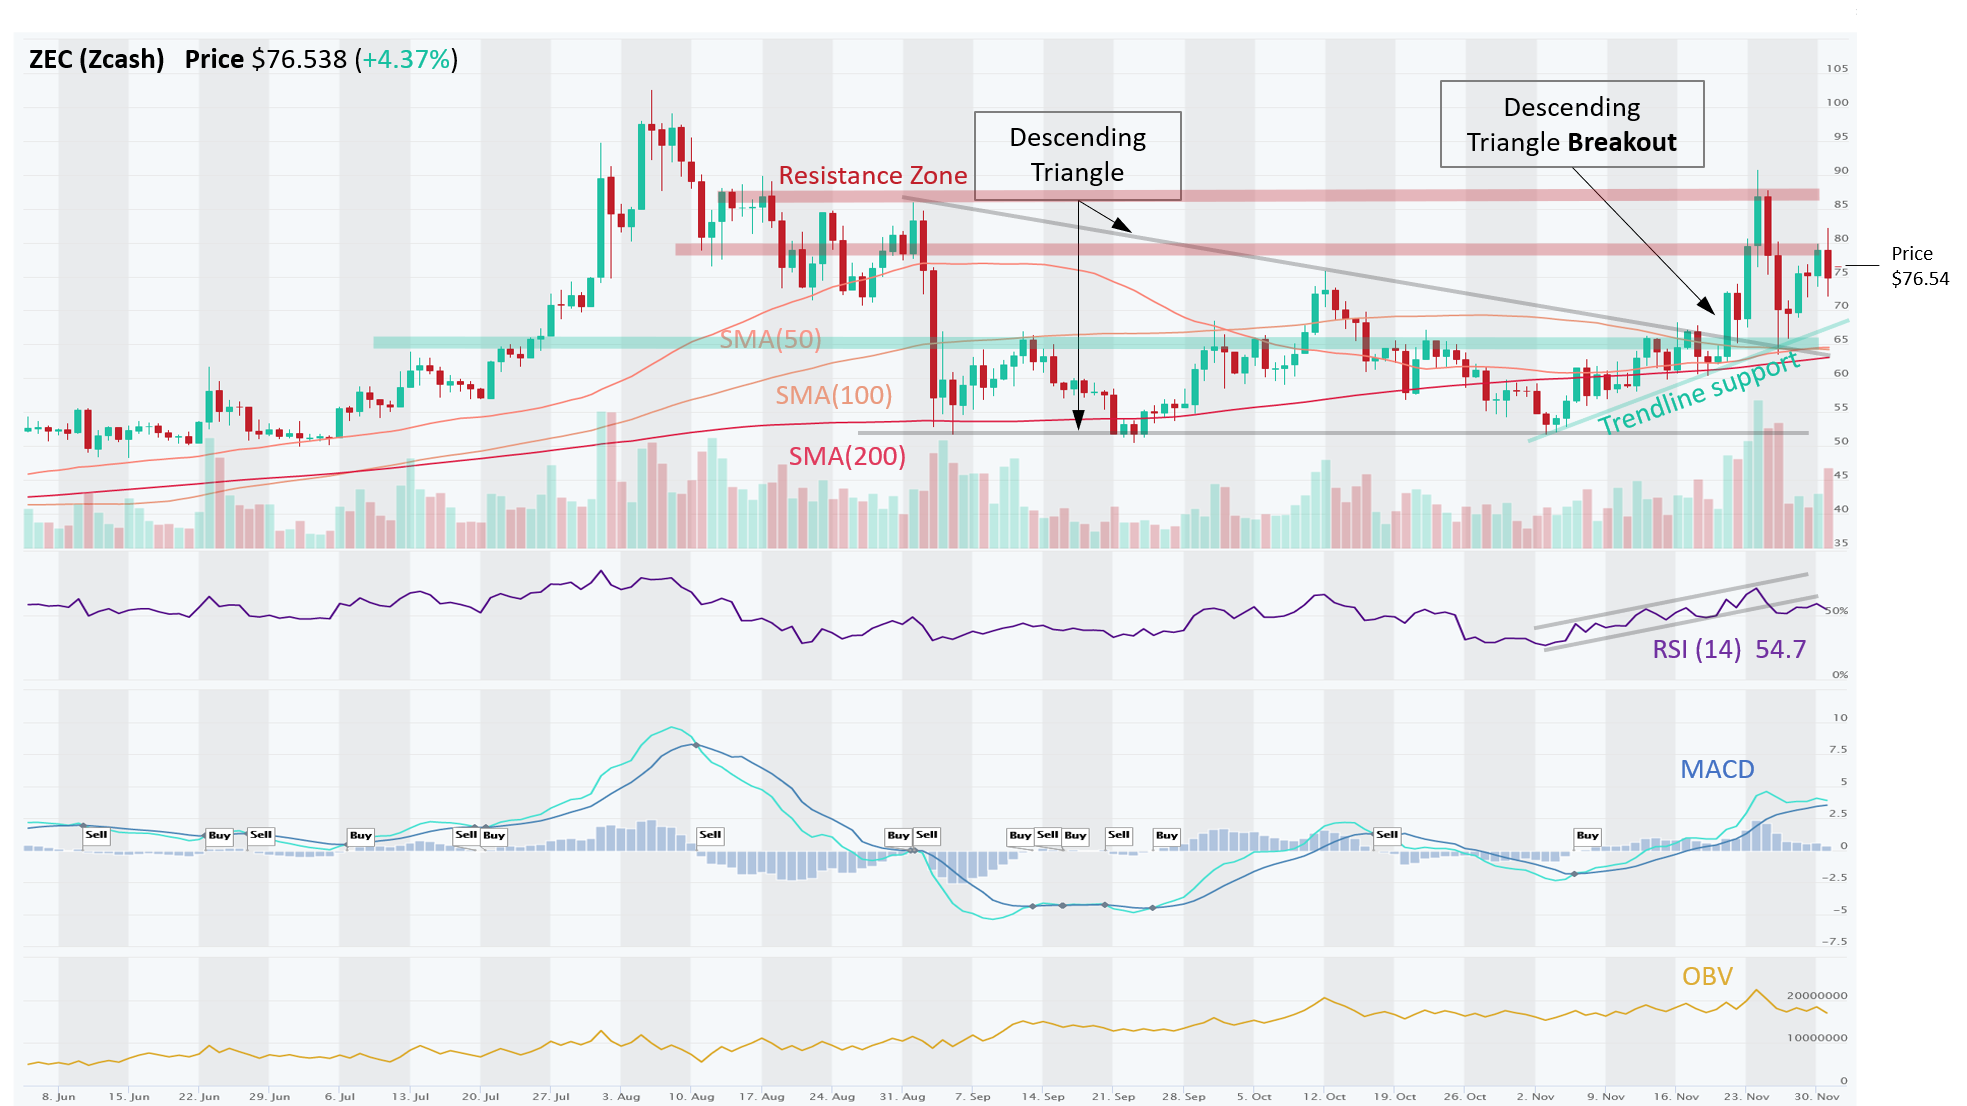
ZEC (Zcash), a privacy cryptocurrency, is in an Uptrend across all time horizons (Short-, Medium-, Long-Term). Zcash evolved from Bitcoin’s code and retained its deflationary monetary policy, which means it goes to reward halving every few years. Following Zcash block reward halving event in November, price broke out of a Descending Triangle on Nov 20, cleared a Resistance Zone at $65, which is now a Support Zone (TA concept known as Polarity). Price is now likely to consolidate between ~$65 Support and ~$80 Resistance Zones.
Momentum (MACD Crossover and RSI > 50) are still bullish but have weakened as the price approached the Resistance, which seems to indicate that demand from buyers is not strong enough to clear this Resistance area, yet. However, if we get a breakout above $80, price could revisit the next Resistance Zone of $85. OBV has been steady, with volume on Up days about equal to Down days, suggesting a relative balance between buyers and sellers. ADX is between 20-40, signaling strong trend and is rising slightly higher (positive). Here’s a good research report on Zcash.
MKR – Stuck in a Sideways Channel
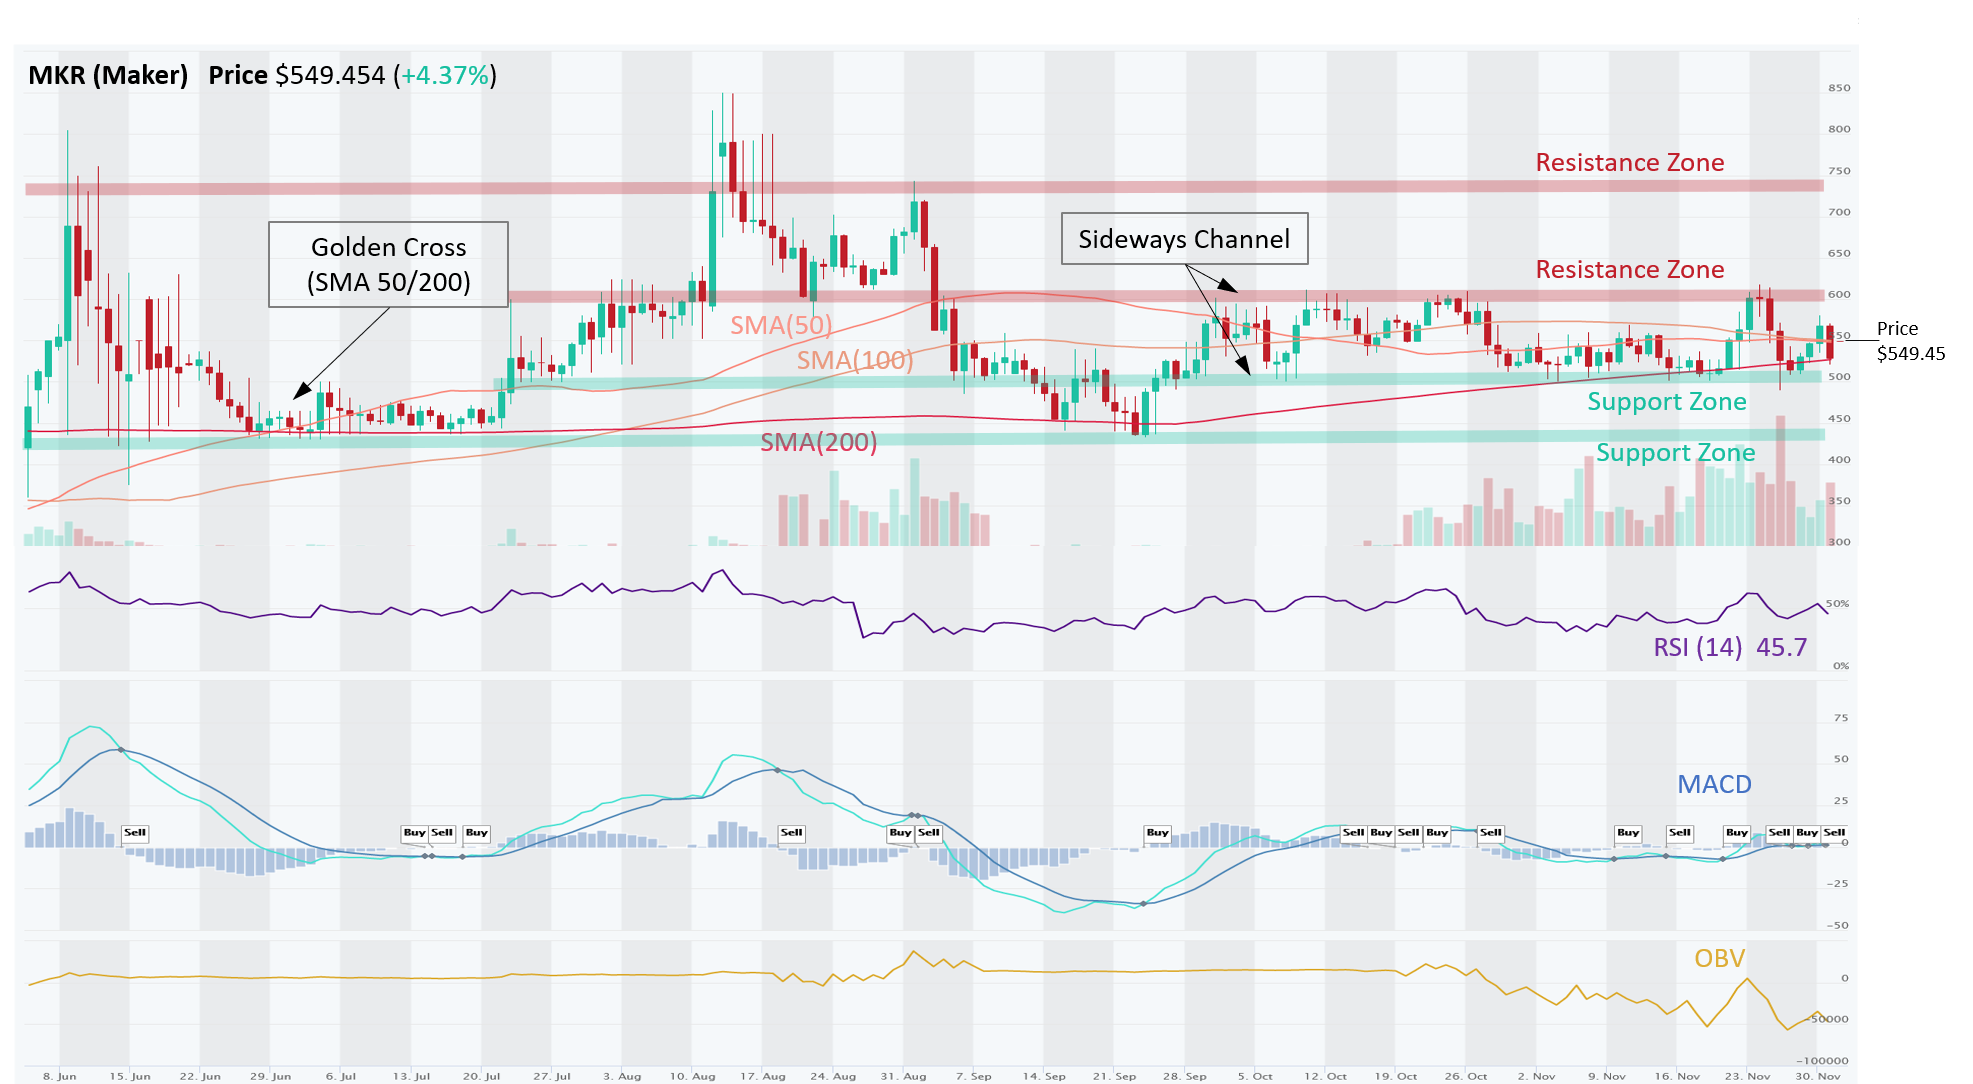
MKR (Maker), one of the earliest DeFi projects, has been trading in a sideways Channel between $500 and $600 for over two months now. This Channel can be traded (Buy Support, Sell Resistance) or traders can wait for a breakout (either up or down). Support Zone is further reinforced by a 200-Day SMA, which the price has respected on several occasions this year. OBV (volume on Up days vs. Down days) has been trending down, indicating that sellers are overwhelming buyers. Momentum is weak with MACD whipsawing between the Resistance and Support zones, and RSI is under 50 (i.e. lack of momentum). Price is likely to bounce off the strong Support Zone and 200-Day SMA, but if not, the next Support is at around $430.
Disclaimer: This content is for informational purposes only, you should not construe any such information or other material as investment, financial, or other advice. There are risks associated with investing in cryptocurrencies. Loss of principal is possible.