Bitcoin's Crossroads: Navigating the Path from the Recent $60K Low

Bitcoin (BTC) has just experienced a significant flush, tagging the $60,050 mark on February 5th, 2026. This sudden drop from its recent peak of over $126,000 has left investors contemplating the path forward. While the immediate bounce has offered some relief, history suggests that bottoming processes are rarely straightforward. Let’s explore three primary scenarios for Bitcoin’s price action from here, weighing their probabilities against historical context.
Scenario 1: The Elusive V-Shaped Bottom (Low Probability)
A V-shaped bottom is characterized by a rapid, sharp decline followed by an equally swift and sustained recovery, with little to no retesting of the lows.
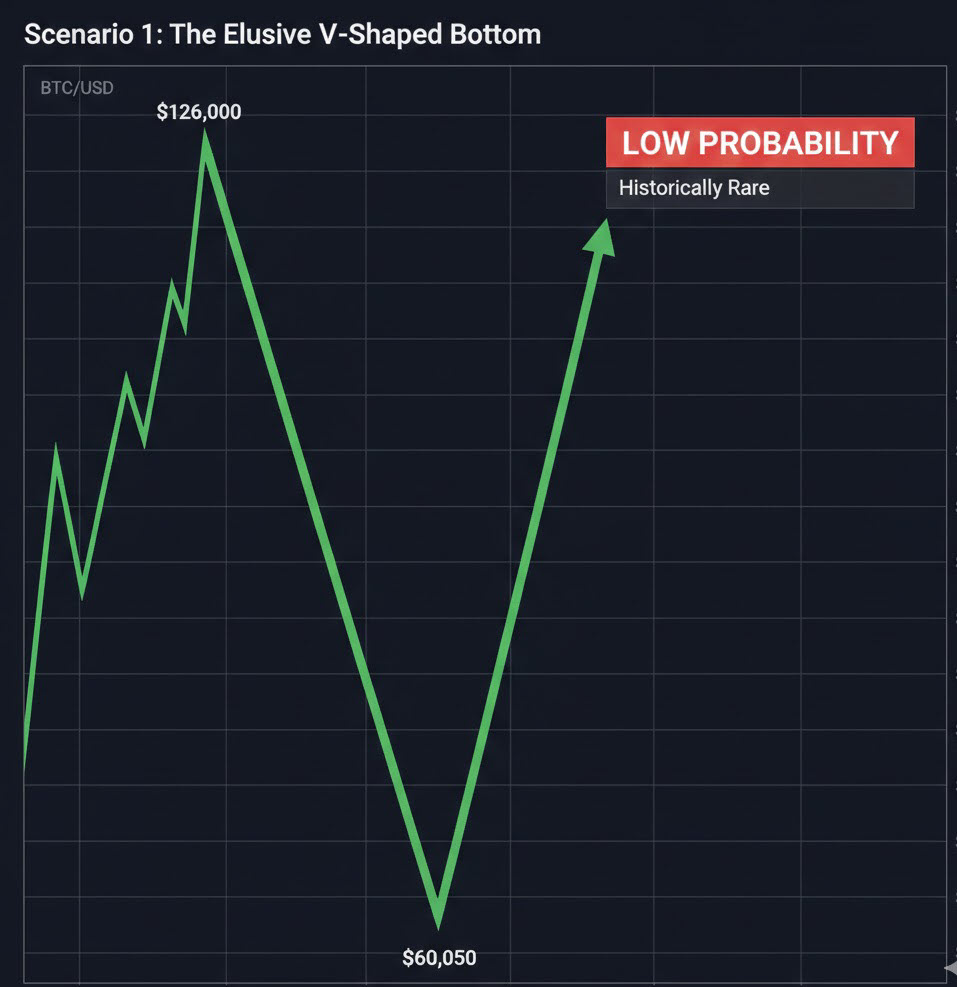
Historical Probability: Low (Approx. 1 in 4)
Why it’s possible:
- Macro Intervention: The most famous V-shaped recovery for Bitcoin occurred during the March 2020 COVID crash. This was largely a global phenomenon where central banks unleashed unprecedented liquidity, fueling a swift rebound across all risk assets. A similar, unforeseen macroeconomic intervention could, in theory, trigger such a bounce.
- Rapid Deleveraging: The speed and severity of the recent drop suggest a significant amount of leveraged positions were wiped out. Sometimes, such a “cleanse” can set the stage for a quick recovery if underlying demand is strong.
Why it’s unlikely:
- Rare Occurrence: V-shaped bottoms are exceptions, not the rule, for Bitcoin. Out of four major bear cycles (2014-15, 2018, 2020, 2022), only the 2020 COVID crash produced a true V-shape.
- Investor Psychology: After a significant drawdown, investor confidence is typically shaken. It takes time for new capital to flow in consistently and for conviction to rebuild.
Scenario 2: The “Typical” Bottoming Process (High Probability)
This scenario aligns with Bitcoin’s historical tendency to form rounded or double-bottoms, involving a test of the lows followed by an extended period of sideways consolidation.
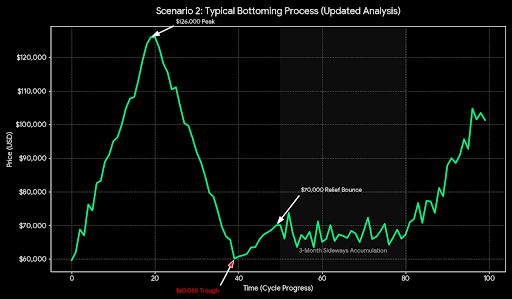
Historical Probability: High (Approx. 3 in 4)
Key Characteristics:
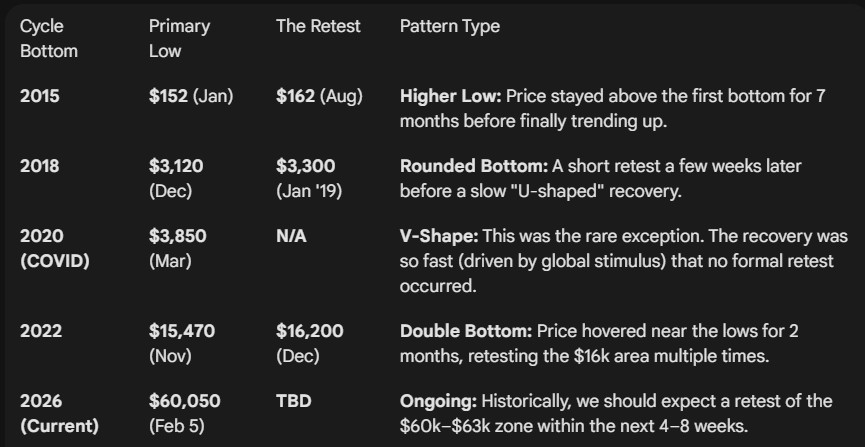
- Initial Bounce & Retest: After the capitulation low ($60,050), price typically experiences a relief bounce (which we’ve seen). However, this bounce is often followed by a retest of the original low, or a slightly higher low, over the next few weeks or months. This confirms that the selling pressure has truly subsided.
- Accumulation Phase: Following the retest, Bitcoin enters a period of low volatility and range-bound trading. This “boring” phase can last for several months (e.g., 2015, 2018, 2022 saw 3-6 months of consolidation). During this time, “smart money” accumulates Bitcoin at suppressed prices while retail interest wanes.
- Volume Profile: Expect decreasing volume on retests of the low, and increasing volume on breakouts from the accumulation range.
Why it’s likely:
- Behavioral Economics: Market participants, having just experienced significant losses, are hesitant to re-enter. This creates a supply overhang that prevents rapid appreciation.
- Whale Activity: Larger entities prefer to accumulate in quiet, low-volatility environments to avoid moving the market against them.
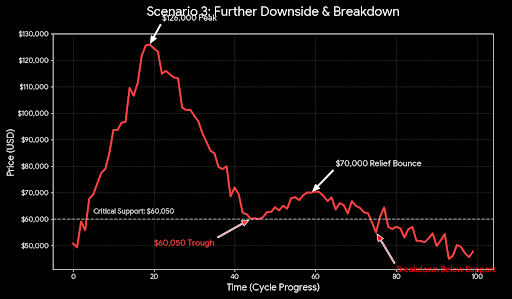
Scenario 3: Further Downside & Deeper Drawdown (Moderate Probability)
While $60,050 appears to be a strong support zone (around the 200-week moving average), there’s always a possibility of further downside if the current level fails to hold.
Historical Probability: Moderate (depending on severity of macro factors)
Key Characteristics:
- Failure of Key Support: The current $60,000–$58,000 zone (which includes the 200-week MA) is a critical psychological and technical support. A sustained break below this level could trigger another wave of forced selling.
- Cascading Liquidations: If initial support breaks, it could trigger further liquidations of leveraged long positions, exacerbating the sell-off.
- Recessionary Fears: A prolonged global recession, coupled with tighter monetary policy from central banks, would significantly reduce investor appetite for risk assets like Bitcoin.
Historical Drawdown Context: Let’s look at historical peak-to-trough drawdowns:
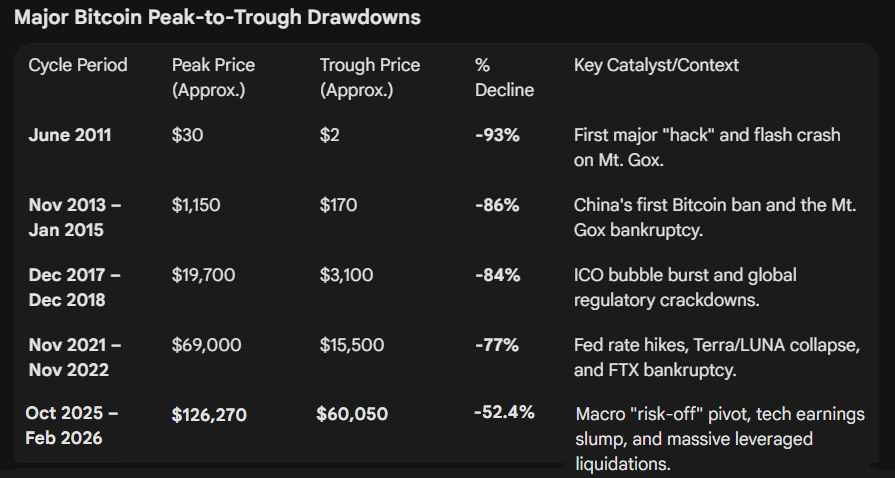
The current drawdown from $126,270 to $60,050 represents a -52.4% decline. While significant, it’s still less severe than the average -85% drawdowns of previous cycles (excluding 2011).
- If we were to hit an average -77% drawdown (like 2022), it would imply a price of around $29,000.
- If we were to hit a -84% drawdown (like 2018), it would imply a price of around $20,200.
Why it’s possible:
- Unforeseen “Black Swan” Event: A new, severe crypto industry collapse or a major geopolitical shock could easily drive prices lower.
- Macro Headwinds: If inflation proves more persistent or interest rates rise higher than expected, risk assets could continue to suffer.
- Lack of New Capital: If institutional adoption stalls or retail interest remains subdued, there might not be enough buying pressure to sustain a recovery.
Conclusion
While the recent bounce from $60,050 is encouraging, history suggests that the most probable path forward for Bitcoin involves a “typical” bottoming process (Scenario 2). Investors should anticipate a potential retest of the $60,000–$63,000 zone and prepare for an extended period of sideways consolidation before a sustained uptrend can begin. The V-shaped recovery remains an outlier, and while less likely, the possibility of further downside to more historical drawdown levels (Scenario 3) cannot be entirely dismissed, especially if global macro conditions deteriorate or new industry-specific shocks emerge.


0 Comments
Leave a comment