


Bitcoin Price Prediction for October: Best Q3 Since 2017, but Can BTC Clear $87K?

Bitcoin just had its best third quarter in nine years. It starts October stuck in a $4,000-wide box, with momentum fading. Here’s what has to break first.
On altFINS daily data, Bitcoin closed June 30 at $58,612 and September 30 at $83,607, a 42.65% gain for the quarter. Ethereum did even better, up 71.59% over the past three months. Yet BTC is trading at $83,916 today, almost exactly where it was a week ago, and well below the $87,395 high it set on September 21.
The altFINS analysts still rate the near-term outlook Bullish, with a resistance breakout above $83K and $90K as the next target. But the daily MACD just crossed below its signal line, and BTC has spent ten days moving sideways between $83K and $87K. This post covers what drove the quarter, the levels that decide October, and why the range itself is the trade to watch.
⚡ Quick Take
BTC: $83,916 (+0.04% today, −0.56% this week, +6.80% this month, +43.17% over three months, RSI 60.2). Range: $82,258 support to the $87,395 September high. From here: +4.1% to $87,395, +7.2% to the $90K analyst target, against −2.0% to $82,258 and −10.6% to the $75K support zone. What confirms the next leg: a daily close above $87,395. What weakens it: a daily close below $82,258.
What’s Driving Bitcoin Price Into October
A record-setting quarter. Bitcoin’s best Q3 since 2017 and Ethereum’s best Q3 ever. It was also BTC’s best quarter of any kind since late 2024, with most of the gains coming after the US Treasury announced its debt buyback program.
A failed $85K breakout. Softer August PCE inflation data pushed Bitcoin above $85,000 on September 30, and altFINS candles show an intraday high of $85,630. The move didn’t hold: BTC slipped back below $84,000 as bond yields jumped. The daily candle closed at $83,607, 2.4% below its high.
Cooling demand, but big buyers are still there. Data shows holders taking more profit and spot demand weakening. At the same time, the largest holders are adding again while retail stays flat. Leverage has also been flushed: speculative futures open interest fell about 90% between September 14 and 29, which lowers the risk of a sudden liquidation cascade. If the range breaks lower, analysts point to the $73,000 short-term holder cost basis as the next big line.
Bitcoin and the Large Caps by the Numbers: Live altFINS Data
Here’s how Bitcoin, Ethereum and the biggest altcoins are starting October on the altFINS screener:
| Coin | Price | 1D | 1W | 1M | RSI 14 | Trend |
|---|---|---|---|---|---|---|
| BTC — Bitcoin | $83,916 | +0.04% | -0.56% | +6.80% | 60.2 | Up |
| ETH — Ethereum | $2,696 | +0.09% | +0.43% | +9.27% | 62.2 | Up |
| BNB — BNB | $769.89 | +0.16% | +0.33% | +11.35% | 56.6 | Strong Up |
| XRP — XRP | $1.490 | -1.55% | -0.72% | +8.00% | 54.2 | Up |
| SOL — Solana | $117.91 | -1.57% | +2.53% | +14.42% | 60.1 | Strong Up |
| HYPE — Hyperliquid | $89.64 | +3.51% | -4.70% | +6.47% | 52.4 | Strong Up |
| DOGE — Dogecoin | $0.0947 | -0.44% | +2.09% | +14.26% | 55.4 | Up |
| ADA — Cardano | $0.2470 | -0.61% | +3.60% | +24.86% | 58.7 | Up |
Every coin in the table gained more than 30% over the past three months, but the past week looks very different: most are within 3% of where they were seven days ago. HYPE is down 4.70% on the week, and XRP and SOL are each down more than 1.5% today. The quarter’s momentum has turned into consolidation across the board, not just in Bitcoin.
How the altFINS Analysts Read the Bitcoin Setup
The altFINS curated setup for Bitcoin is a Resistance Breakout. BTC broke out of a Channel Down and above its 200-day moving average, which signaled a bullish trend reversal. After consolidating in a Bullish Flag, it broke above $83K resistance, and the analysts see $90K as the next stop. Right now it’s consolidating in a sideways range between $83K and $87K.
The trend picture is solid: short-term Up, medium-term Strong Up, long-term Strong Up. RSI14 at 60.2 is neither overbought nor oversold. The caution flags come from the altFINS signal feed: a fresh bearish MACD crossover on the daily chart overnight, a run of Doji candles (indecision), and an oversold Stochastic RSI reading. Momentum is resetting inside the range rather than pushing through it.
📊 Bitcoin Key Levels (altFINS analyst setup)
- Breakout level: $83K, the resistance BTC cleared in September
- Range top: $87,395, the September 21 high
- Targets: $90K, then $97K
- Range floor: $82,258
- Support zones: $75K, then $70K
- Moving averages: 50-day $77,708, 200-day $71,350
- RSI14: 60.2, neutral; daily MACD just crossed bearish
Range Trading Math: Why Where You Enter Matters More Than the Target
When a coin is boxed between two levels, the same $90K target can be a good or a bad trade depending on where you get in and where you’d admit you’re wrong. Here’s the math from today’s $83,916:
- Stop under the range floor ($82,258): +7.2% to $90K against −2.0% risk. That’s about 3.6-to-1, but a 2% stop sits inside Bitcoin’s normal daily noise.
- Stop at the $75K support zone: +7.2% against −10.6%. That’s about 0.68-to-1, so you’d be risking more than you stand to make.
- Wait for a close above $87,395, target $97K, stop $82,258: +11.0% against −5.9%, about 1.9-to-1. You give up the first 4.1%, but you trade a confirmed breakout instead of a guess.
None of these is “right”. It’s a choice between a tight stop that gets hit often, a wide stop with poor reward, or waiting for confirmation and paying a higher price. The rule works for any range: the closer you are to the floor, the better the math. In the middle of the box, waiting is usually the best option.
Which Large Caps Still Have Room Before Resistance?
Sorted from least to most stretched by RSI14, with the distance to the nearest altFINS resistance level. These are levels to watch, not signals to act on.
HYPE, RSI 52.4: The coolest reading after a 4.70% weekly drop. Resistance at $98.03 is 9.4% above.
XRP, RSI 54.2: Down 1.55% today. Resistance at $1.658 is 11.3% above, the most headroom among the big three altcoins.
DOGE, RSI 55.4: Resistance at $0.1059 is 11.9% above, the widest gap in the group.
BNB, RSI 56.6: The steadiest of the group, flat on the week. Resistance at $807.53 is 4.9% above.
ADA, RSI 58.7: Up 24.86% this month. Resistance at $0.2653 is 7.4% above.
SOL, RSI 60.1: Resistance at $124.94 is 6.0% above.
BTC, RSI 60.2: 4.1% below the $87,395 range top. See the levels box above.
ETH, RSI 62.2: The warmest reading, after a 71.59% three-month run. Resistance at $2,807 is 4.1% above.
Bitcoin Price Prediction: Technical Chart Analysis
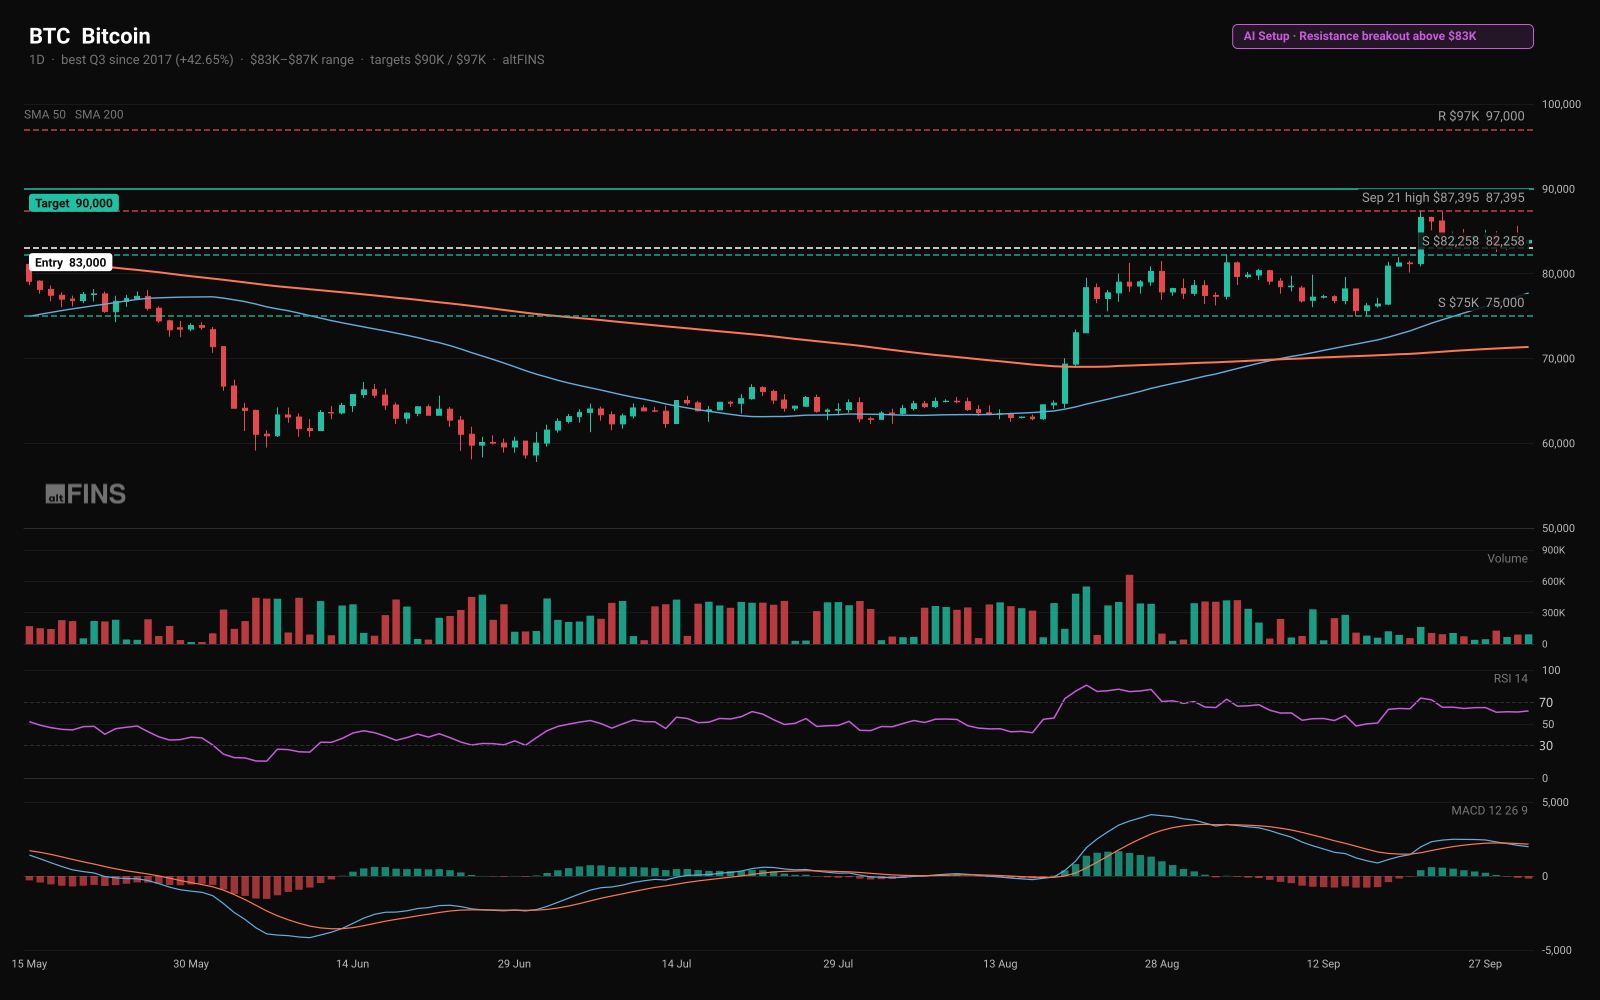
Bitcoin is 8.0% above its 50-day moving average ($77,708) and 17.6% above its 200-day ($71,350), and the 50-day is rising above the 200-day. That is the structure of an uptrend taking a breather. Reaching the $126,218 all-time high would still take a 50.4% gain. Three scenarios frame October:
- Closes above $87,395: the range breaks up, the analysts’ $90K target comes into play, and $97K is next.
- Stays between $82,258 and $87,395: the most likely path while MACD resets. It gives RSI room to cool without damaging the trend.
- Closes below $82,258: the breakout above $83K is failing, and a pullback toward the $75K support zone and the rising 50-day average opens up.
📌 Key Takeaways
- Bitcoin gained 42.65% in Q3 2026 on altFINS data, its best third quarter since 2017. Ethereum gained 71.59% over the past three months.
- BTC is at $83,916, ranging between $82,258 and the $87,395 September high after a failed push above $85K on September 30.
- The altFINS analysts’ outlook is Bullish with targets at $90K and $97K, but the daily MACD just crossed bearish.
- From mid-range the math is mixed: a confirmed break above $87,395 offers about 1.9-to-1 toward $97K.
- A daily close above $87,395 confirms the next leg; a close below $82,258 points to $75K.
Frequently Asked Questions
What is the Bitcoin price prediction for October 2026?
The altFINS analysts rate Bitcoin’s near-term outlook Bullish, with a Resistance Breakout setup above $83K and a next target of $90K, then $97K. For now BTC is moving sideways between $83K and $87K, and a fresh bearish MACD crossover suggests the range may hold a while longer. A daily close above the $87,395 September high would put $90K in play; a close below $82,258 would open a move toward the $75K support zone. This is education, not a forecast you should trade on.
How much did Bitcoin rise in Q3 2026?
On altFINS daily data, Bitcoin closed June 30 at $58,612 and September 30 at $83,607, a gain of 42.65% for the quarter. That makes it the best third quarter since 2017 and the best quarter overall since late 2024. Even so, BTC is still down 4.22% year to date and 33.49% below its $126,218 all-time high.
What are the key Bitcoin support and resistance levels right now?
Resistance is the September 21 high at $87,395, then the $90K and $97K zones from the altFINS analyst setup. Support is $82,258, then $75K and $70K. The 50-day moving average is at $77,708 and the 200-day at $71,350, both well below price, which keeps the medium- and long-term trends rated Strong Up.
Set alerts at $82,258 and $87,395 and track the range breakout live, with support, resistance and trend scores for every coin on the altFINS screener.
👉 Open the Free Crypto Screener on altFINS →
Disclaimer: This article is for education and information only. It is not financial advice, not a recommendation to buy or sell any asset, and not a solicitation. Crypto is highly volatile and you can lose your entire capital. Always do your own research. altFINS and its team may hold positions in assets mentioned.
Related Posts

 Written byLenka Fetyko
0 Comments
Leave a comment