Big Trend Reversal Coming?

altcoins have been in a nasty downtrend since peaking in late December.
Check out these returns since their 52-week highs. Altcoins are down 50% or more…
% Change From 52-week Highs
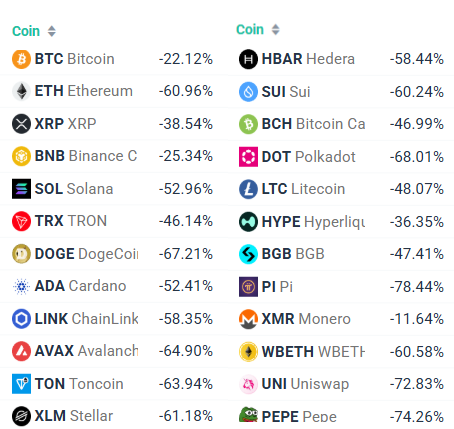
See altcoins performance on Crypto Screener.
However, we are seeing many altcoins trading in Falling Wedge and Channel Down patterns.
These patterns typically resolve in bullish breakouts and a trend reversal. At least a temporary reversal, good for 20-50% gains.
SOL is a good example: SOL: Falling Wedge Pattern Breakout
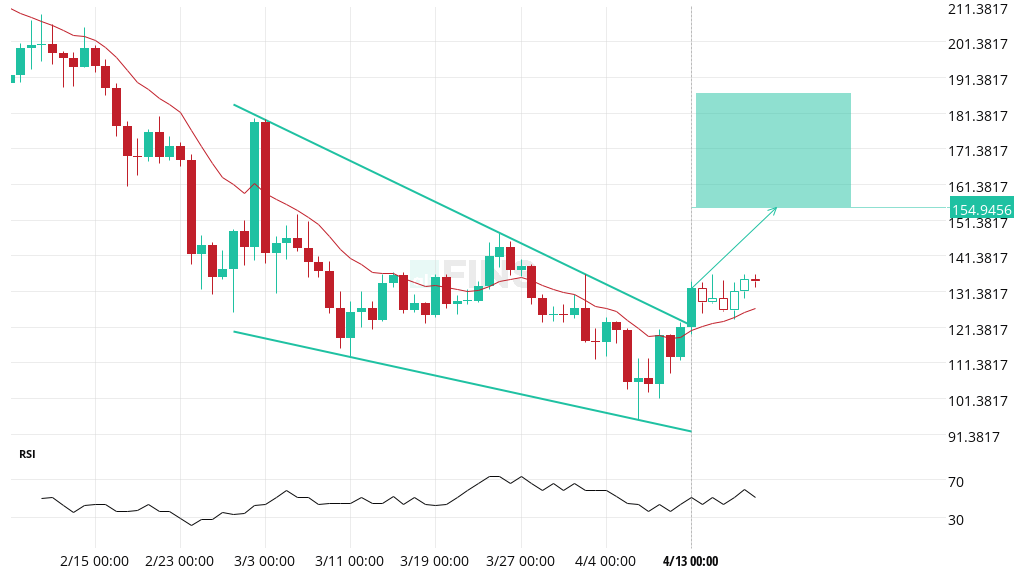
When prices break out from these two patterns, they can move up quickly.
Traders should prepare for such bullish breakouts, set up alerts and use the altFINS mobile app to stay on top of trading opportunities.
Setting up chart pattern alerts is just a couple of clicks away: here’s how.
We teach trading Chart Pattern breakouts in our new Crypto Trading Course (10 lessons, 40 videos, 7 trade strategies, quizzes, notes, risk management, short selling, margin trading).
Our historical data shows that Channel Down breakouts have 73% success rate and Falling Wedge breakouts have 64% success rate. Check all stats here.
Do not miss these potentially profitable opportunities!
You can find them on altFINS platform in three sections:`
1) Chart Patterns (search for Channel Down and Falling Wedge pattern types)
2) Technical Analysis (search for Channel Down and Falling Wedge pattern types)
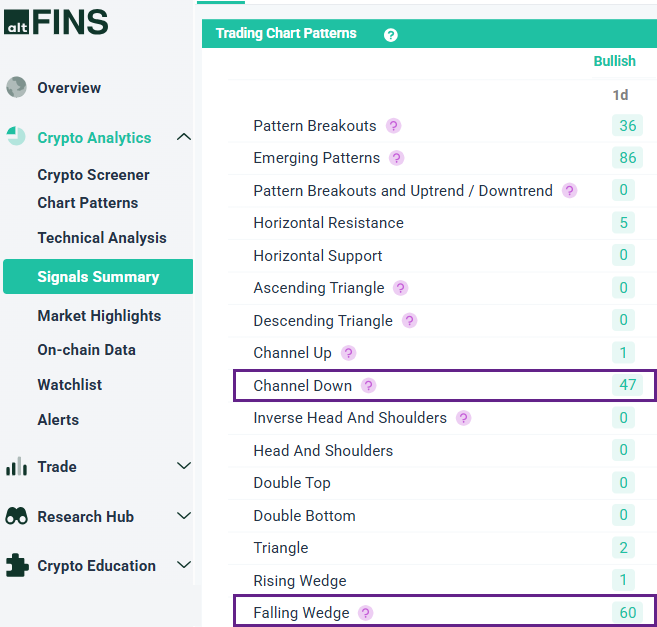
3) Signals Summary – under Patterns section.
TIP: Never miss another trading signal. Create an alert for any chart pattern and receive notifications on your phone! Here’s how.
Signals Summary – Patterns Section
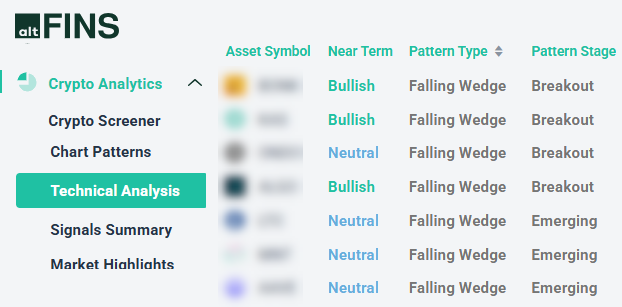
Technical Analysis (50+ trade setups) – Channel Down and Falling Wedge
We have identified more assets trading in Channel Down and Falling Wedge patterns. These could result in a breakout soon.
Find them in our Technical Analysis section where we keep trade setups for 65+ major altcoins.
Trade setups include Take Profit and Stop Loss levels for risk management.
Don’t miss these potentially big gainers on breakouts!
Trade Setups
These two chart pattern types are common trend reversal patterns. They often emerge in a downtrend, characterized by lower highs and lower lows.
But at some point, supply from sellers is absorbed by the buyers, the selling pressure is neutralized and steadily growing number of traders and investors find value at these lower levels.
Then, price finally breaks out and it is often followed by rapid price movements (i.e. profits).


0 Comments
Leave a comment