altFINS Introduces Automated Support & Resistance Detection

altFINS members have been waiting months for this major release — and it’s finally live!
We’re proud to introduce Automated Support & Resistance detection across 2000+ cryptocurrencies and 5 timeframes, fully integrated into screeners, charts, and alerts — along with 6 brand-new preset market filters designed to instantly surface breakout and breakdown opportunities.
This feature allows traders to quickly identify breakout opportunities, breakdown risks, and high-probability reversal setups, without manually drawing trendlines or levels.
Support and Resistance are the foundation of the technical analysis.
Every breakout, every breakdown, every trend reversal begins at a key price level. These levels define market structure, risk management, entry points, and profit targets. Yet until now, identifying them required manual chart work — coin by coin, timeframe by timeframe.
Now, the most important concept in technical analysis is fully automated across the altFINS platform.
No more subjective line drawing.
No more missed breakout setups.
No more manual scanning.
Just objective, data-driven Support & Resistance — at scale. 🚀
Watch Tutorial Video
What Is Automated Support & Resistance Detection?
Support and Resistance are key technical analysis concepts used to identify important price levels where:
- Support = price tends to stop falling and bounce
- Resistance = price tends to stop rising and pull back
Traditionally, traders must manually draw these levels on charts. This process is:
- Time-consuming
- Subjective
- Inconsistent across timeframes
- Impossible to scale across thousands of coins
altFINS solves this problem with algorithmic detection of Support & Resistance levels, automatically calculated across:
- 5 time intervals
- 2000+ cryptocurrencies
- Web platform
- Email, mobile and web alerts
Why Automated Support & Resistance Matters in Crypto Trading
Crypto markets are volatile. Breakouts and breakdowns often happen quickly. Missing a key level can mean missing the move.
With automated S/R detection, traders can:
- Identify coins breaking above resistance
- Detect coins breaking below support
- Spot assets approaching key levels
- Set alerts before major volatility events
Instead of manually scanning charts, you can let altFINS surface opportunities in seconds.
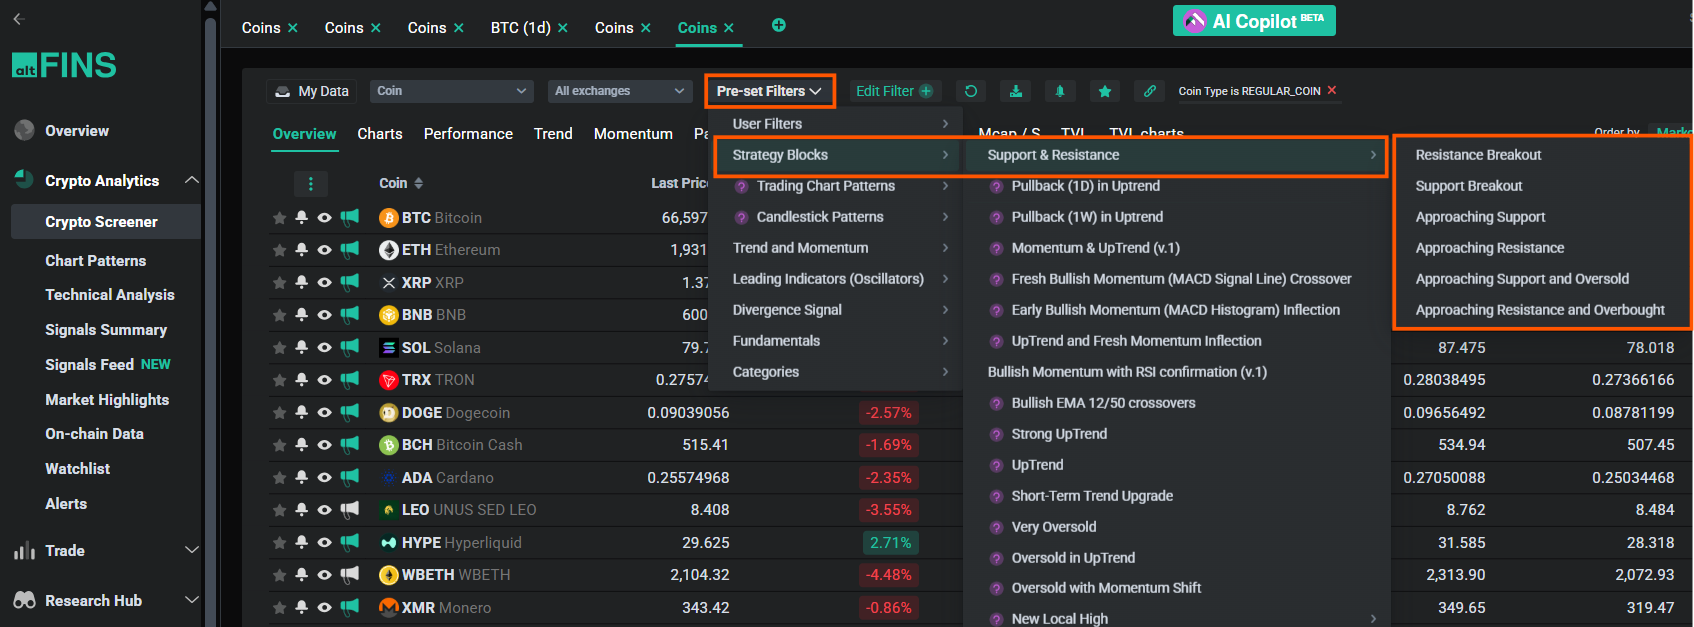
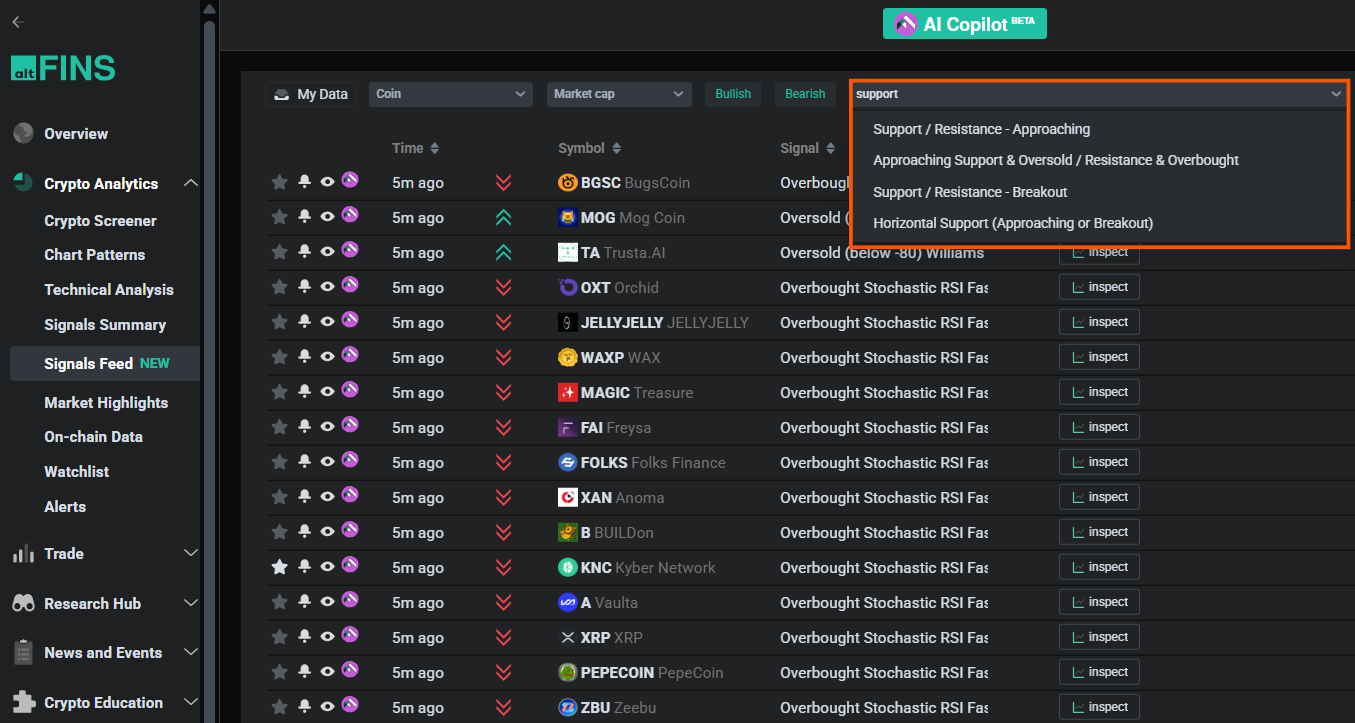
New Preset Market Scans Based on Support & Resistance
In addition to chart overlays, altFINS now offers preset market filters specifically designed to identify:
1️⃣ Resistance Breakout
What it finds: Coins breaking above a key resistance level.
Why it matters: A breakout above resistance often signals the start of a new upward trend, especially when confirmed by volume and momentum. Traders use this setup to catch early trend continuation moves.
2️⃣ Support Breakout (Breakdown)
What it finds: Coins breaking below a key support level.
Why it matters: When support fails, selling pressure often accelerates. This strategy helps identify potential downside continuation or short opportunities.
3️⃣ Approaching Support
What it finds: Coins trading close to an identified support level.
Why it matters: Support levels can act as bounce zones. Traders monitor these areas for potential reversal entries with defined risk.
4️⃣ Approaching Resistance
What it finds: Coins trading near a resistance level.
Why it matters: Resistance often acts as a price ceiling. Traders watch for either breakout setups or potential pullbacks from this zone.
5️⃣ Approaching Support and Oversold
What it finds: Coins near support while momentum indicators (e.g., RSI) show oversold conditions.
Why it matters: This combination increases the probability of a technical bounce, as price is both structurally supported and momentum is stretched to the downside.
6️⃣ Approaching Resistance and Overbought
What it finds: Coins near resistance while momentum indicators show overbought conditions.
Why it matters: This setup highlights potential exhaustion near key resistance levels, signaling a higher probability of pullback or rejection.
These preset scans eliminate guesswork and dramatically reduce research time.
You can combine these scans with:
- Trend Ratings
- RSI (Relative Strength Index)
- MACD (Moving Average Convergence Divergence)
- Volume indicators
All available on altFINS platform.
This creates a powerful, multi-factor trading framework that increases the probability of identifying strong setups.
How to Use Support & Resistance on altFINS
You can access automated Support & Resistance levels in:
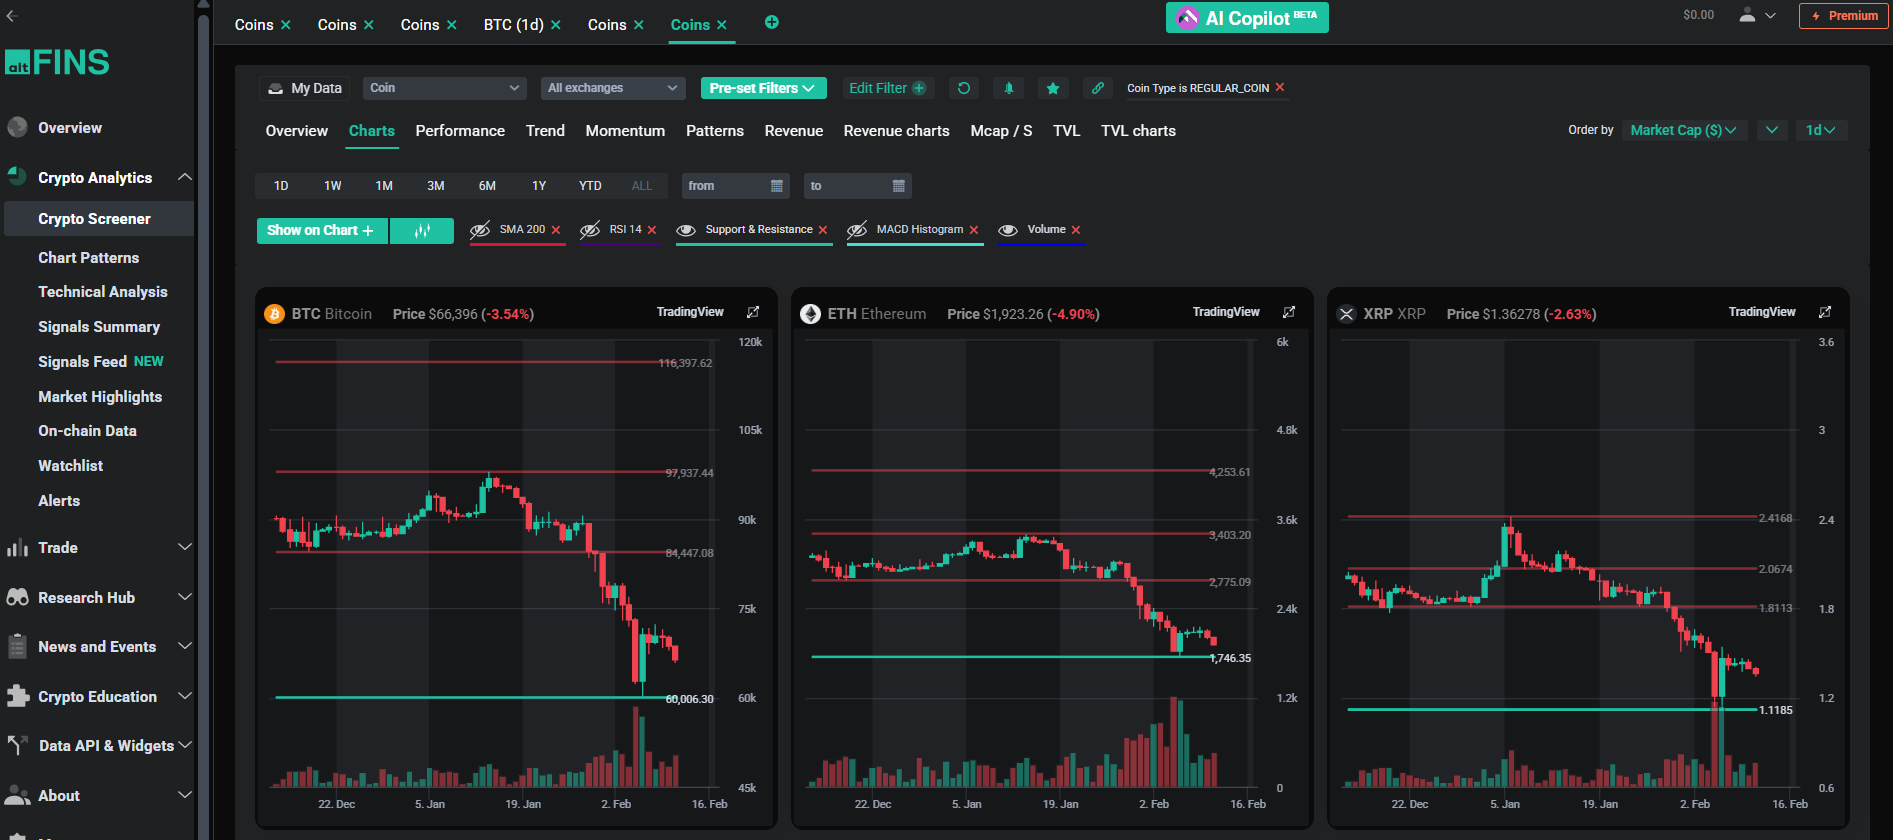
- Individual coin detail pages
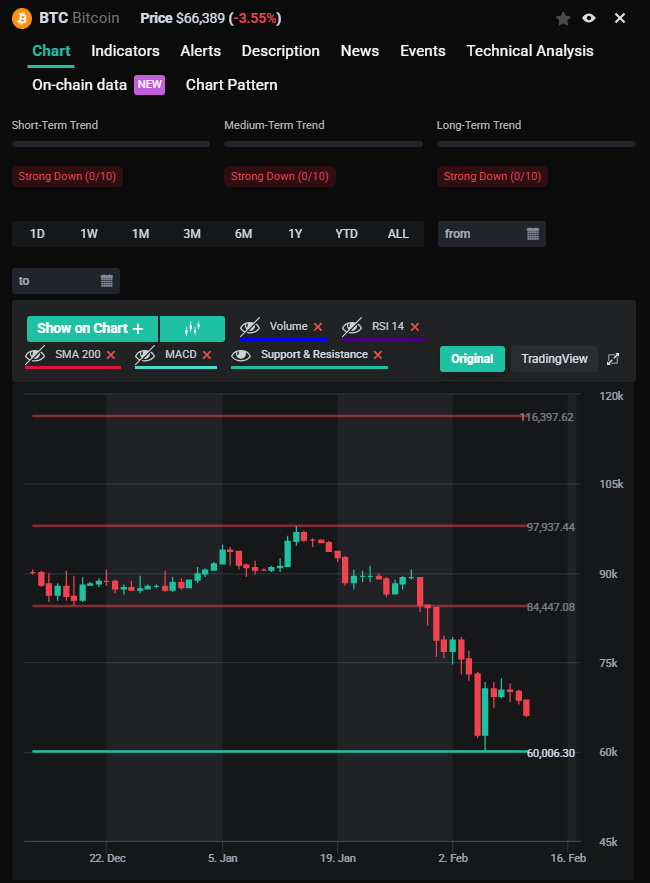
This allows you to monitor breakout setups in real time and react faster than manual traders.
Combining Support & Resistance With Momentum Indicators
Support & Resistance works best when confirmed by trend and momentum.
Examples:
- Resistance breakout + strong Trend Rating = potential continuation trade
- Support hold + bullish RSI divergence = possible reversal
- Breakdown below support + bearish MACD crossover = confirmation of weakness
By combining structural price levels with momentum signals, traders can filter out low-quality setups and focus on higher-probability trades.
Frequently Asked Questions (FAQ)
What is Support in crypto trading?
Support is a price level where buying pressure historically prevents the price from falling further. When price approaches support, it may bounce upward.
What is Resistance in crypto trading?
Resistance is a price level where selling pressure historically prevents the price from rising further. When price approaches resistance, it may reverse downward.
What is a breakout?
A breakout occurs when price moves above a resistance level with strong momentum or volume. Breakouts often signal the start of a new upward trend.
What is a breakdown?
A breakdown happens when price falls below a support level. This often signals increased selling pressure and potential continuation lower.
Why are Support and Resistance important?
Support and Resistance help traders:
- Identify entry and exit points
- Set stop-loss levels
- Manage risk
- Confirm trend direction
They are foundational tools in technical analysis.
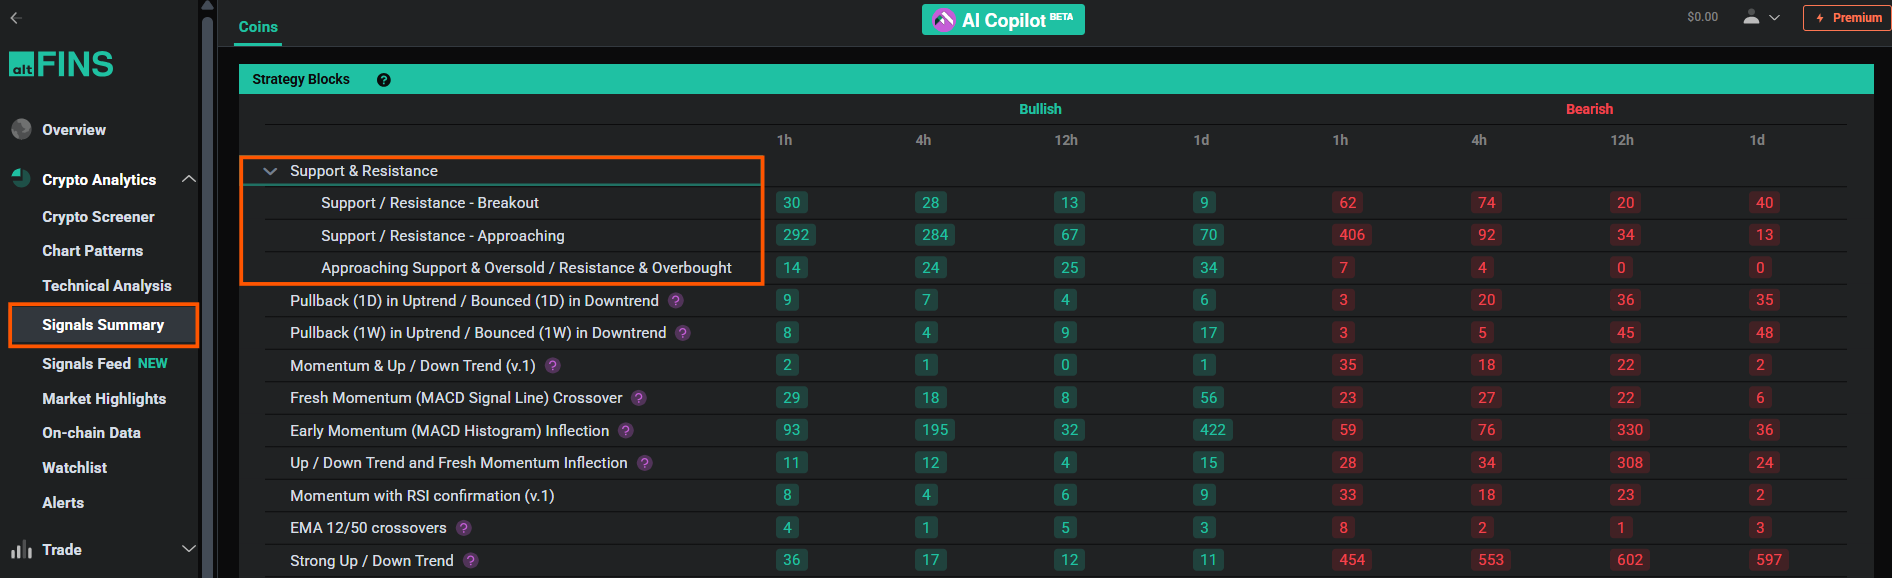
How does altFINS automate Support & Resistance?
altFINS uses proprietary algorithms to automatically detect statistically significant price levels across multiple timeframes and thousands of coins.
The system continuously updates these levels and integrates them across Crypto Screener, Signals Summary and Signals Feed.
This removes subjectivity and allows traders to scale their analysis.
Can I set alerts for breakouts and breakdowns?
Yes. Traders can receive alerts via:
- Web platform
- Mobile app
This ensures you never miss key price movements.
Why This Makes altFINS Different
Most platforms provide charts. Some provide indicators.
altFINS provides automated market structure intelligence.
By combining:
- Automated Support & Resistance
- Preset breakout scans
- Trend ratings
- Momentum indicators
- Alerting system
altFINS delivers a complete, automated crypto trading workflow — from idea discovery to execution.
Start Finding Breakouts Faster
With automated Support & Resistance detection and new preset scans, altFINS helps traders:
- Save time
- Remove bias
- Scale analysis across 2000+ coins
- Identify breakout opportunities early
Explore the new features today and experience the only platform that automates Support & Resistance at scale.
0 Comments
Leave a comment