Trading Falling Wedge and Channel Down Patterns

Watch Free Trading Videos
As we predicted in our members’ group, the markets have bounced off oversold levels. But there are some big moves ahead potentially, and you don’t want to miss these.
We’re seeing many altcoins consolidating in Falling Wedge and Channel Down patterns. These could generate big gains on breakouts!
Our CEO, Richard, has prepared two free trading videos for you:
Video1: How to Find and Trade Falling Wedge and Channel Down Patterns:
Video2: How to Find and Swing Trade Assets in Uptrend & Fresh Bullish Momentum:
Our historical data shows that Channel Down breakouts have a 73% success rate, and Falling Wedge breakouts have a 64% success rate. Check all stats [here].
Trading Strategies
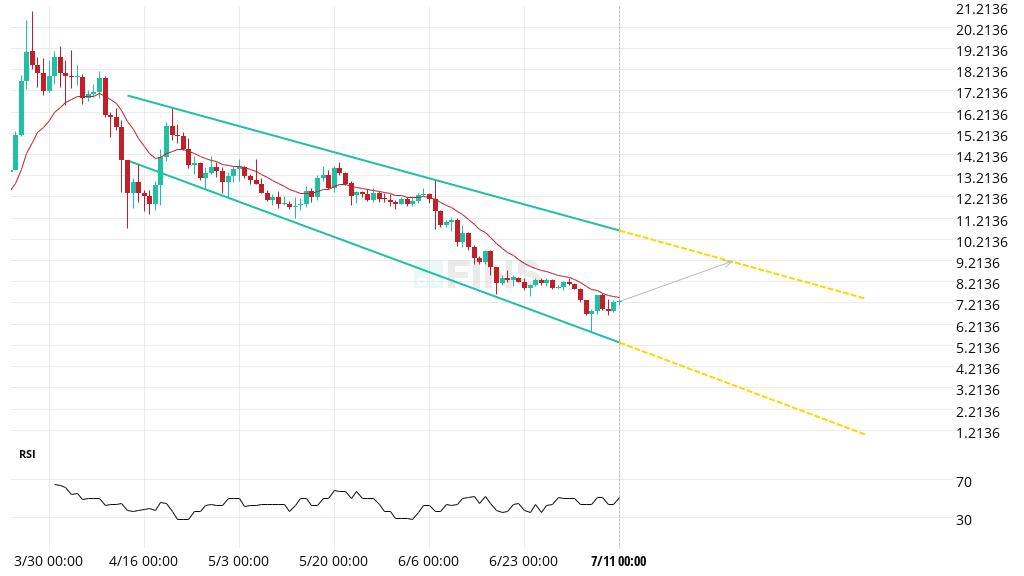
Emerging patterns can be traded if the range is still wide: buy near channel support and sell near channel resistance trendlines. Here’s an example of a potential +21% profit on a trade setup:
ICP: Emerging Channel Down pattern

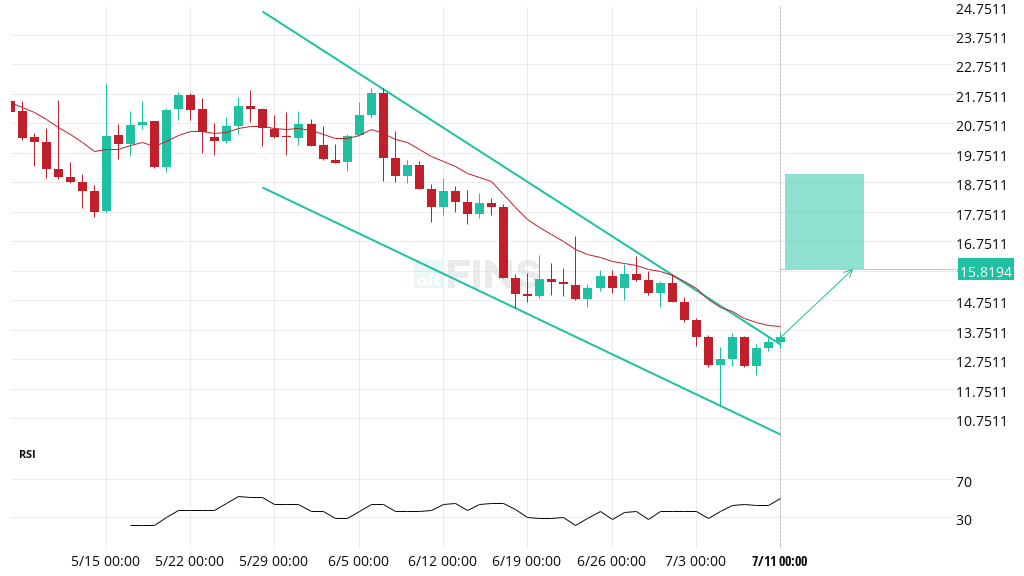
Or traders can wait for breakouts. When prices break out from these patterns, they can move up quickly. In fact, we’ve already seen some breakouts:
DCR: Channel Down Breakou
+17% Profit Potential
Traders should prepare for such bullish breakouts, set up alerts, and use the altFINS mobile app to stay on top of trading opportunities. Setting up price alerts is just a couple of clicks away: here’s how.
Learn Crypto Trading
We have unlocked our Crypto Trading Course to all users until July 31st! It includes:
- 10 lessons
- 40 videos
- 7 trade strategies
- Quizzes
- Notes
- Risk management
- Short selling
- Margin trading
Don’t hesitate to learn how to profit from crypto volatility. You also get a chance to win a Lifetime Premium plan.
Finding Trading Opportunities
You can find trading opportunities on the altFINS platform in three sections:
- Chart Patterns: Search for Channel Down and Falling Wedge pattern types.
- Technical Analysis: Search for Channel Down and Falling Wedge pattern types.
- Signals Summary: Under the Patterns section.
TIP: Never miss another trading signal. Create an alert for any chart pattern and receive notifications on your phone! Here’s how.
These two chart pattern types are common trend reversal patterns. They often emerge in a downtrend, characterized by lower highs and lower lows. But at some point, supply from sellers is absorbed by the buyers, the selling pressure is neutralized, and a steadily growing number of traders and investors find value at these lower levels. Then, the price finally breaks out, often followed by rapid price movements (i.e., profits).
Happy Trading!
0 Comments
Leave a comment