SUI Price and Market Overview (October 2024)
SUI Price
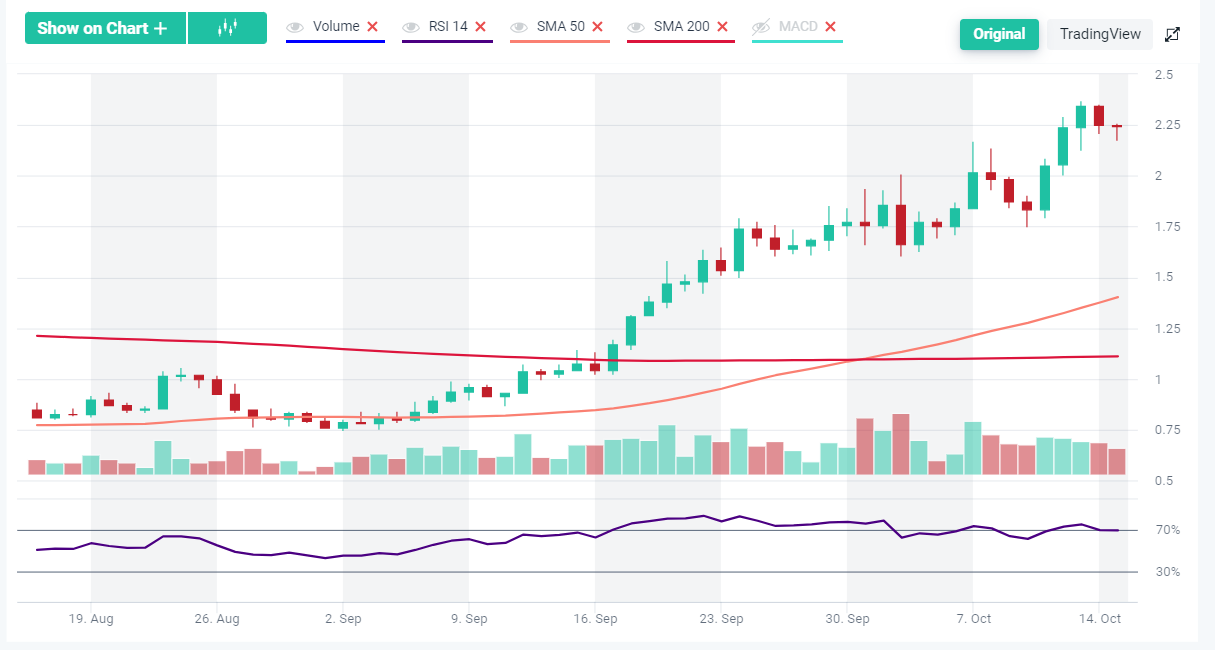
Current Price: $2.2344 (-0.39% in the last 24 hours, +10.76% over the last 7 days).
Market Cap: $6.16 billion
Volume: $465.61 million
Circulating Supply: 2.76 billion SUI
All-Time High (ATH): $2.3674 (October 13, 2024), down -5.62% from ATH.
SUI Price on Daily Interval
SUI Trends:
Short-Term Trend: Strong Up
Medium-Term Trend: Strong Up
Long-Term Trend: Strong Up
Key Indicators:
MACD: Bullish (near-term momentum).
RSI: Neutral, not overbought or oversold.
Stochastic: Overbought, showing potential caution for further upside.
Bollinger Bands: Price is within the band, indicating stable price movement.
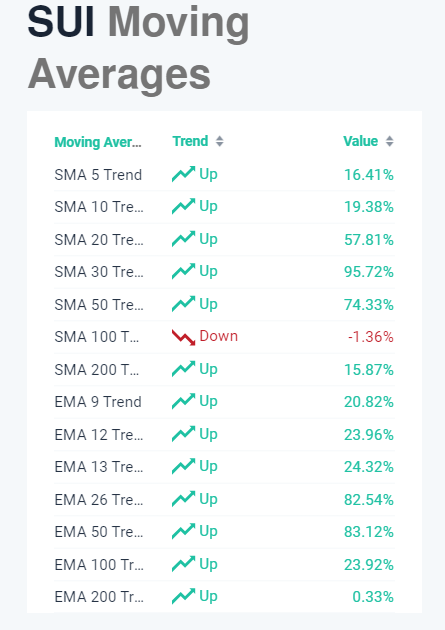
Moving Averages:
SMA and EMA show upward trends across most time frames, indicating continued price strength.
SMA 50: +74.33%
EMA 26: +82.54%
EMA 200: +0.33%
Performance:
1 Month: +113.86%
3 Months: +176.73%
1 Year: +437.50%
Year-to-Date (YTD): +188.19%
Key Developments:
- SUI is gaining rapid adoption in the Layer 1 blockchain space.
- Experts predict strong upward momentum for SUI and related assets.
- Notable partnerships and integrations, such as the launch of native USDC on the SUI Network.
Conclusion:
SUI continues its impressive growth, driven by strong technical momentum and increasing market interest. Investors should watch for potential pullbacks due to overbought conditions but remain optimistic about long-term growth as SUI solidifies its position in the blockchain landscape.
More info:


0 Comments
Leave a comment