Revenue And TVL Charts Now Available on altFINS

We’ve made it even easier to analyze DeFi projects on altFINS!
Until now, you could track Total Revenue (TR) and Total Value Locked (TVL) through our analytics tables. Now, you can visualize these metrics with interactive charts.
What You’ll See
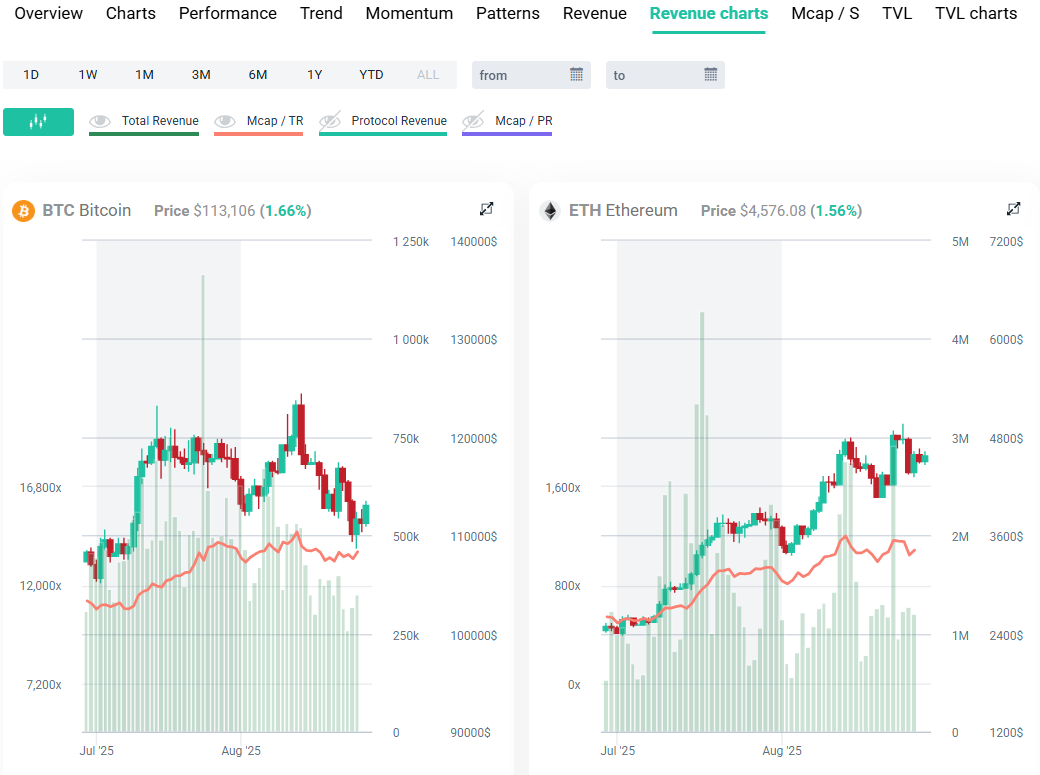
- Revenue (TR) Charts – Track protocol revenues (fees collected by the protocol) and supply-side revenues (fees earned by liquidity providers, validators, etc.) over time.
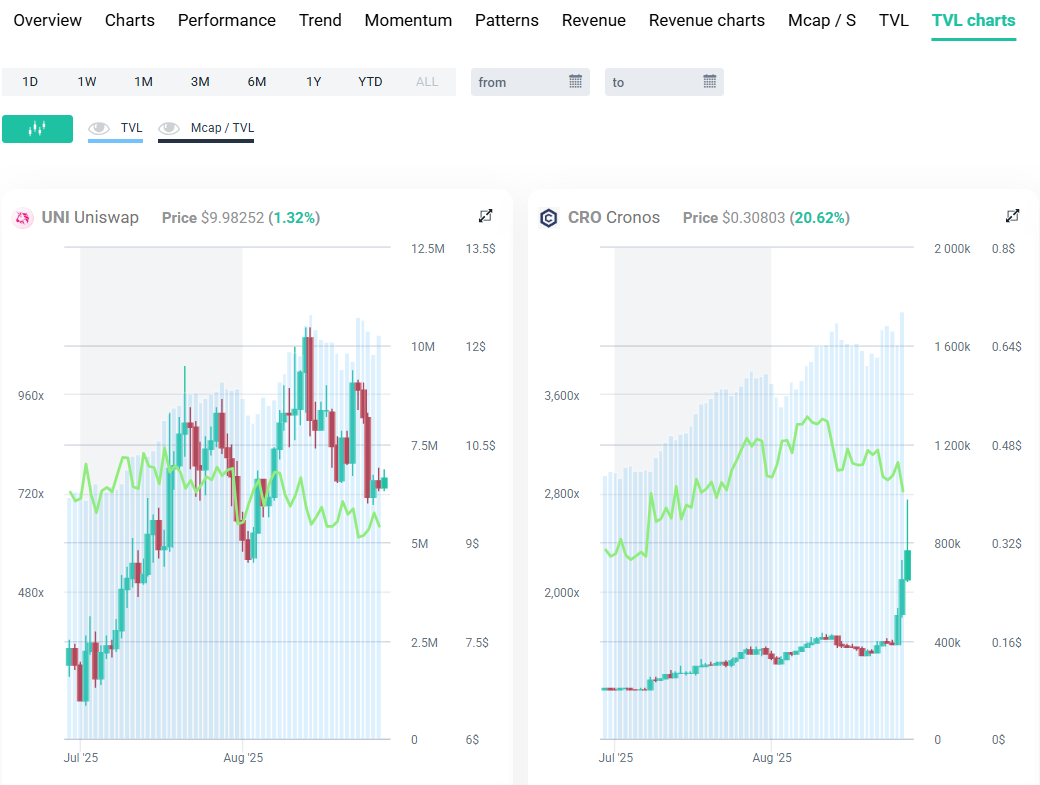
- TVL (Total Value Locked) Charts – See how much value is being locked in a protocol’s smart contracts, a key indicator of adoption and user confidence.
Why Charts Matter
- Spot trends and growth patterns at a glance
- Identify shifts in adoption and protocol strength faster
How to Find Them on altFINS?
- Switch between Revenue charts and TVL charts tabs to see the new charts in action.
- Head to altFINS today and explore TVL & Revenue charts on your favorite tokens.
Checking TVL and Revenue is essential because together they show the real health of a project beyond just price. TVL reflects how much capital investors are willing to lock into a protocol, signaling trust, adoption, and utility, while Revenue reveals actual user demand through fees paid, highlighting whether the protocol generates sustainable income.
Rising TVL shows growing confidence, and strong Revenue shows real usage – together they provide a clearer picture of long-term strength and value than price alone.
Get ready for the upcoming features,
altFINS team!
0 Comments
Leave a comment