


NEAR Price Prediction: First US Spot NEAR ETF Pushes NEAR Above $5.10. Is $6.30 Next?

NEAR Protocol has nearly tripled in a month, and on Tuesday it got its own US spot ETF. Today it’s back above the breakout level the altFINS analysts flagged. The trend is as strong as it gets. The entry isn’t.
NEAR is trading at $5.27, up 10.46% today and 182.40% over the past month on the altFINS screener. It set a 52-week high of $5.58 on September 27, dipped to $4.55 on September 29, and has now climbed back above the $5.10 resistance level named in the altFINS analyst setup. See the live NEAR analysis.
Short-, medium- and long-term trends are all rated Strong Up. But RSI14 is at 75.1, overbought, and the analysts’ own note says they expect a pullback as traders take profits. This post covers why NEAR is moving, which levels matter, and why the math favors patience here.
⚡ Quick Take
NEAR: $5.27 (+10.46% today, +19.23% this week, +182.40% this month, RSI 75.1). It is back above the $5.10 breakout level after Bitwise launched the first US spot NEAR ETF. From here: +5.9% to the $5.58 52-week high and +19.6% to the $6.30 analyst target, against −13.7% to the September 29 low of $4.55 and −30.7% to the $3.65 support zone. What confirms it: a daily close above $5.58. What weakens it: a daily close back below $4.55.
What’s Driving NEAR Protocol Price Right Now
A US spot ETF. Bitwise started trading the Bitwise NEAR ETF on NYSE Arca on Tuesday, September 29, under the ticker NRR. It is the first US spot product tied to NEAR, and it stakes the tokens it holds, so American investors can collect NEAR’s staking yield without running a validator. The fund charges a 0.75% annual fee, and 33% of staking rewards go to fees, shared between Bitwise, its validator affiliate and a third party.
The market started pricing this in early. NEAR jumped about 26% when the ETF’s registration became effective and NYSE Arca approved the shares for listing.
Record NEAR Intents volume. NEAR’s cross-chain swap service has been busy. NEAR roughly doubled in a week on record Intents volume, with one caveat: part of the value locked there grows when deposited Zcash rises, not from fresh capital.
A reputational test. After the $388 million Bitget hack on September 24, NEAR Intents flagged more than $50 million in attempted swaps linked to the attackers and turned them away, though most of the funds then moved through other providers. It’s a test of the service’s “permissionless” pitch, and so far it hasn’t hurt the price.
Layer-1 Coins by the Numbers: Live altFINS Data
NEAR is leading a broad Layer-1 recovery. Here are the major smart-contract platforms with active altFINS analyst setups, plus Bitcoin and Ethereum for context:
| Coin | Price | 1D | 1W | 1M | RSI 14 | Trend |
|---|---|---|---|---|---|---|
| NEAR — NEAR Protocol | $5.269 | +10.46% | +19.23% | +182.40% | 75.1 | Strong Up |
| ICP — Internet Computer | $3.419 | +2.61% | +13.31% | +37.80% | 72.3 | Strong Up |
| AVAX — Avalanche | $11.12 | -3.61% | -1.57% | +51.88% | 66.5 | Strong Up |
| SUI — Sui | $1.153 | -1.07% | +12.81% | +55.02% | 65.0 | Strong Up |
| SOL — Solana | $119.34 | +0.10% | +0.73% | +13.08% | 62.5 | Strong Up |
| DOT — Polkadot | $1.221 | +1.30% | +0.23% | +44.49% | 59.6 | Strong Up |
| BTC — Bitcoin | $83,731 | -0.31% | -2.80% | +7.10% | 59.8 | Up |
| ETH — Ethereum | $2,691 | -0.98% | -2.25% | +9.52% | 61.8 | Up |
Every Layer-1 in the table has a Strong Up short-term trend and is up double digits on the month. NEAR stands out on both: it’s the only one up more than 100% and the only one besides ICP with RSI above 70. Bitcoin is quiet at $83,731, down 2.80% on the week, so NEAR’s move is coin-specific, not a market-wide rally.
How the altFINS Analysts Read the NEAR Breakout
The altFINS curated setup for NEAR is a Resistance Breakout. NEAR broke out of a Falling Wedge and above its 200-day moving average earlier this month, which signaled a new uptrend. It has now also cleared $5.10 resistance, and the next resistance zone at $6.30 becomes the target.
The analysts rate the near-term outlook Neutral rather than Bullish, for one reason: momentum may have peaked. The MACD line is still above its signal line, but the histogram bars are shrinking. The altFINS signal feed has also flagged overbought RSI-9, Stochastic and Williams %R readings this morning, alongside a bullish MA Ribbon signal.
📊 NEAR Breakout Levels (altFINS analyst setup)
- Breakout level: $5.10
- First resistance: $5.58, the 52-week high from September 27
- Target: $6.30, the next resistance zone
- Line in the sand: $4.55, the September 29 low
- Support zones: $3.65, then $3.15
- RSI14: 75.1, overbought; the analysts expect a pullback
Risk/Reward Math: Why a Great Trend Can Be a Bad Entry
A strong trend tells you direction. Risk/reward tells you whether the entry is worth it. Measure both distances from today’s $5.27:
- Reward to the $6.30 target: +19.6%
- Risk to the $3.65 support zone: −30.7%
- Ratio: about 0.64-to-1. You’d be risking more than you stand to make.
Using the September 29 low of $4.55 as a tighter line improves the ratio, but only to about 1.4-to-1 (+19.6% against −13.7%). And a tighter line comes with a higher chance of being shaken out in a coin that fell 18.5% from its high in two days this week.
That’s why the analysts are waiting for a pullback rather than chasing. After a parabolic run, the better entries usually come on a retest of the breakout level, when the distance to support is shorter. The rule works for any coin: if the nearest real support is farther away than the target, wait.
Which Layer-1 Coins Still Have Room?
RSI14 and the nearest resistance show how stretched each coin is, sorted from least to most stretched. These are levels to watch, not signals to act on.
DOT, RSI 59.6: The least stretched name. Flat on the week at +0.23%, and just under resistance at $1.31, with $1.66 next.
SOL, RSI 62.5: Up 13.08% on the month and trading below resistance at $124.94. The 50-day average at $101.25 is well below price.
SUI, RSI 65.0: Up 12.81% this week, with resistance at $1.29, about 12% above the current price.
AVAX, RSI 66.5: Down 3.61% today after a 51.88% month. It is pulling back just under resistance at $11.80.
ICP, RSI 72.3: Just pushed above $3.36 resistance and up 13.31% this week. Overbought, like NEAR.
NEAR, RSI 75.1: The most stretched in the group. See the levels box above.
NEAR Price Prediction: Technical Chart Analysis
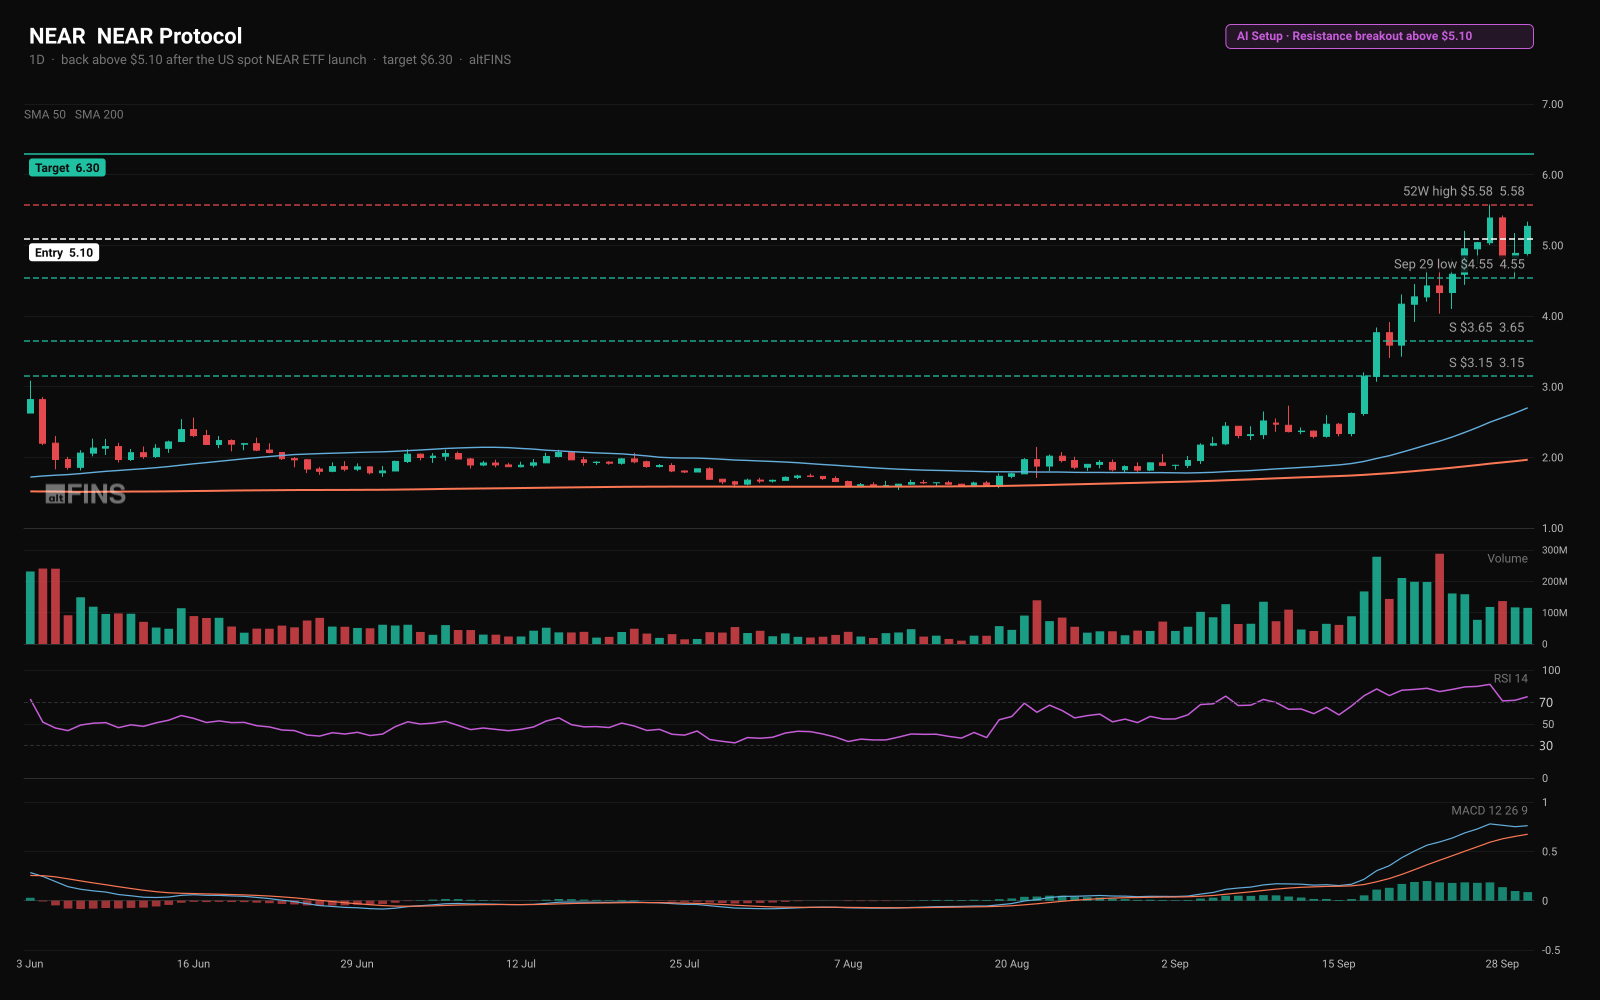
NEAR went from a September 16 close of $2.62 to the $5.58 high on September 27, a 112.8% run in eleven days. Price is now 168.0% above its 200-day moving average ($1.97) and 95.1% above its 50-day ($2.70). Three scenarios frame the next move:
- Closes above $5.58: a new 52-week high confirms the breakout, and the $6.30 target comes into play.
- Chops between $4.55 and $5.58: the most likely path if momentum keeps fading. It would let RSI cool off without breaking the trend.
- Closes below $4.55: the breakout is failing, and a deeper pullback toward the $3.65 support zone opens up.
📌 Key Takeaways
- Bitwise launched the first US spot NEAR ETF (NRR) on NYSE Arca on September 29, with staking and a 0.75% fee.
- NEAR is at $5.27, back above the $5.10 breakout level and up 182.40% on the month, with Strong Up trends on every timeframe.
- RSI14 is 75.1 and MACD momentum is fading; the altFINS analysts expect a pullback.
- From here the math is under 1-to-1: +19.6% to the $6.30 target against −30.7% to the $3.65 support zone.
- A daily close above $5.58 confirms the breakout; a close below $4.55 says it’s failing.
Frequently Asked Questions
Why is NEAR price going up?
Bitwise launched the first US spot NEAR ETF on NYSE Arca on September 29, 2026, under the ticker NRR. The fund holds NEAR and stakes it, charging a 0.75% annual fee. Record volume on NEAR Intents, its cross-chain swap service, has added to the move. NEAR is up 10.46% today, 19.23% this week and 182.40% over the past month on the altFINS screener.
Is NEAR a buy at $5.27?
The trend is Strong Up on every timeframe, but NEAR is overbought, with RSI14 at 75.1. From $5.27, the altFINS analysts’ $6.30 target is 19.6% away, while the nearest support zone at $3.65 is 30.7% below. That is less than 1-to-1, which is why the analysts expect a pullback as traders take profits. This is education, not a recommendation.
What are the key NEAR support and resistance levels?
$5.10 is the breakout level the altFINS analysts are watching, and the 52-week high of $5.58 from September 27 is the first resistance. The next target is $6.30. On the downside, the September 29 low of $4.55 is the nearest line, then the support zones at $3.65 and $3.15. The 50-day moving average is at $2.70 and the 200-day at $1.97.
Spot breakouts like NEAR’s the day they trigger, and set alerts for the pullbacks that follow, with live support, resistance and trend scores for every coin on the altFINS screener.
👉 Open the Free Crypto Screener on altFINS →
Disclaimer: This article is for education and information only. It is not financial advice, not a recommendation to buy or sell any asset, and not a solicitation. Crypto is highly volatile and you can lose your entire capital. Always do your own research. altFINS and its team may hold positions in assets mentioned.
Related Posts


 Written byLenka Fetyko
0 Comments
Leave a comment