Looking For Fresh Trading Ideas?

Learn How To Trade Chart Patterns
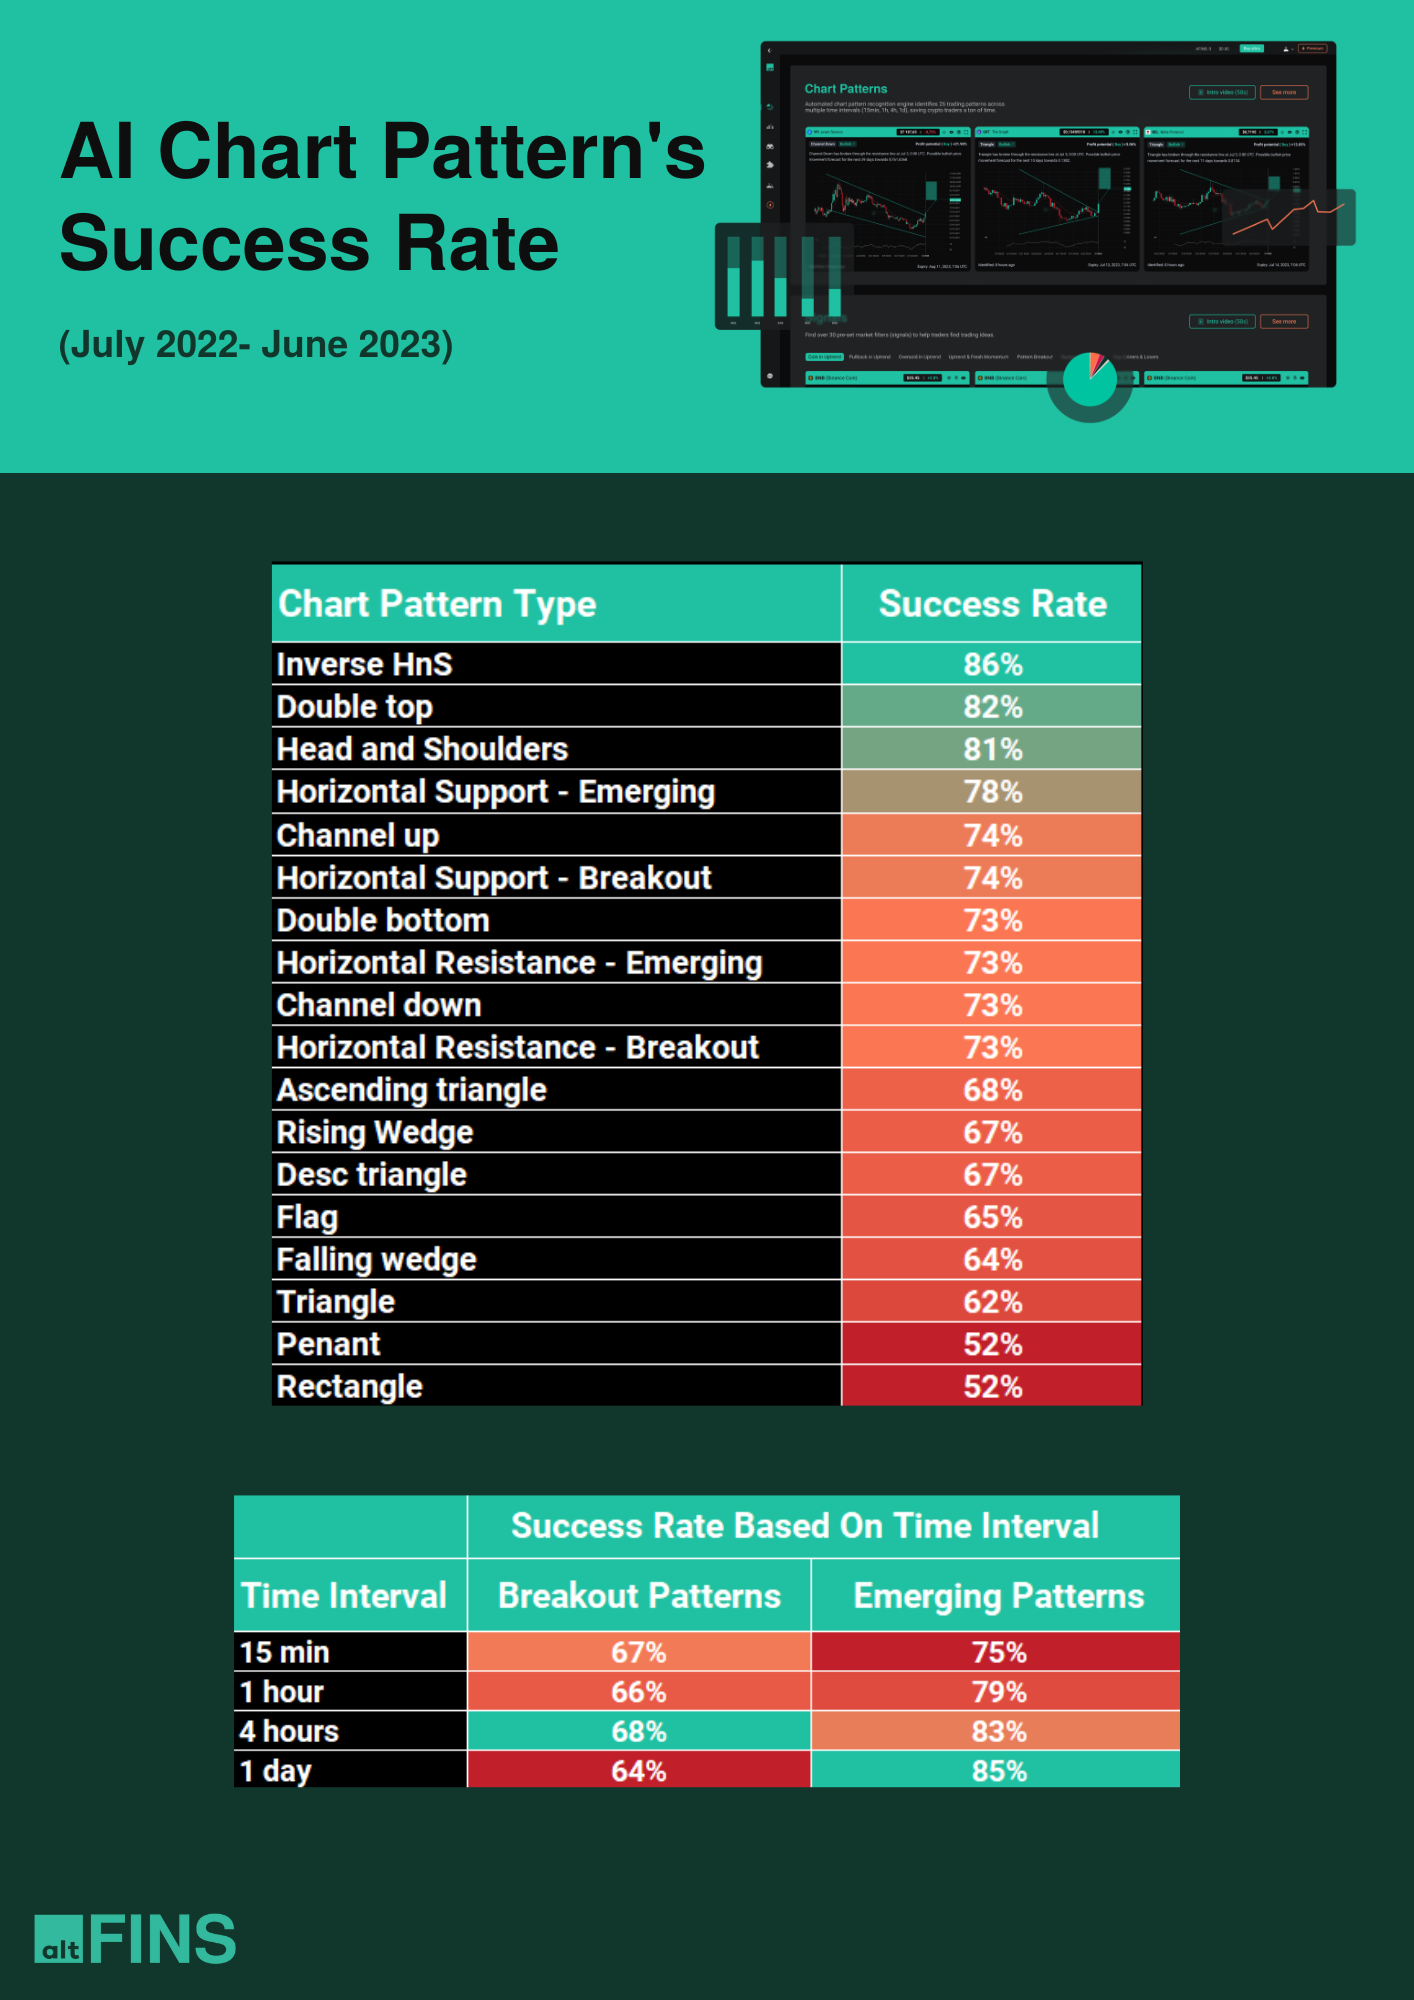
Inverse Head and Shoulders (bullish) and Head and Shoulders (bearish) are chart patterns with the highest success rates: 86% and 81%.
Here’s a trade signal that our system identified recently:
ETC: Head and Shoulders (+18% Potential Gain)
We teach trading Chart Patterns in Lesson 8 of our new Crypto Trading Course, which covers 7 trading strategies, margin trading, short selling and risk management.
☑ Introducing our latest free Tutorial Video: Custom Chart Pattern Filters!
In this step-by-step guide, we’ll walk you through the process of creating and utilizing custom chart pattern filters to enhance your trading strategies. Watch Tutorial Video
altFINS’ automated chart pattern recognition engine identifies 26 trading patterns across multiple time intervals (15 min, 1h, 4h, 1d), saving traders a ton of time, including:
- Ascending / Descending Triangle
- Head and Shoulders, Inverse Head and Shoulders
- Channel Up / Down
- Falling / Rising Wedge
- Double Bottom / Top
- Triple Bottom / Top
- Bullish / Bearish Flag
- Bullish / Bearish Pennant
- Rectangle
- Support / Resistance and other.
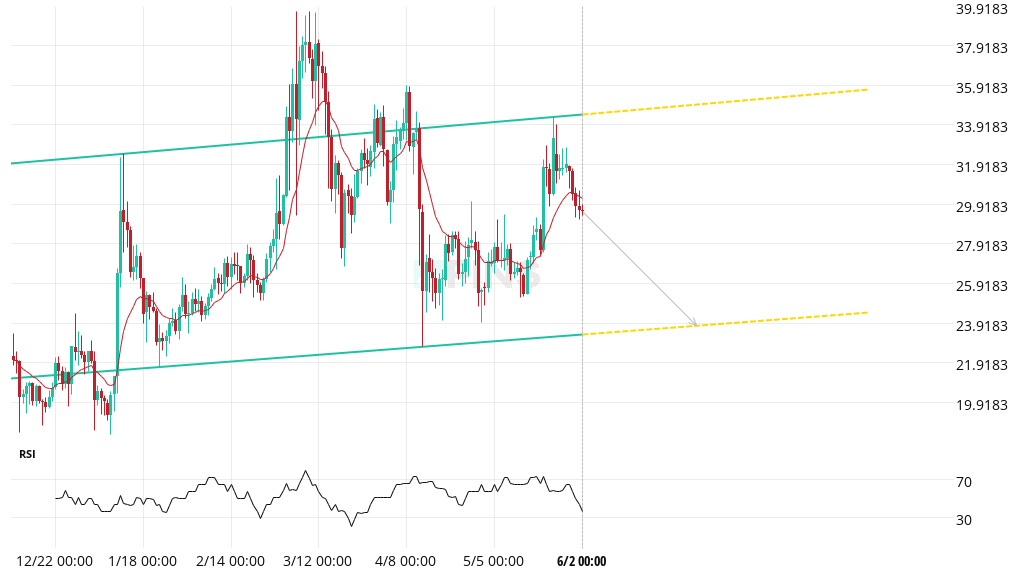
Price patterns appear when traders are buying and selling at certain levels, and therefore, price oscillates between these levels, creating chart patterns.
When price finally does break out of the price pattern, it can represent a significant change in sentiment.
Watch this introduction video to learn more about our AI chart patterns.
But how to trade chart patterns?
Beginners should stick with the patterns that are easiest to understand and have the highest success rates.
That means Horizontal Resistance, Ascending Triangle, Channel Down, Falling Wedge, Inverse Head and Shoulders. Those patterns tend to have 67-83% success rate.
The best time to enter a pattern trade is when it’s freshly identified and published on altFINS platform.
However, some traders wait for 1-2 candles (1D, 1H…, depending on time interval selected) to confirm the price path.
Do you want to start using chart patterns in your trading? Learn more in the article!
0 Comments
Leave a comment