How to Spot Trend Reversals in Crypto Markets
Crypto and stock markets are still in a clear downtrend, with most assets trading below their 200-day Moving Averages. There are a few exceptions, but overall, the bearish momentum continues.
In these conditions, traders typically profit by short selling the bounces. (We have a tutorial video on that if you want to check it out.)
At the same time, it’s important to stay alert for potential trend reversals — because that’s where the biggest upside often begins.
Some early signs are starting to emerge.
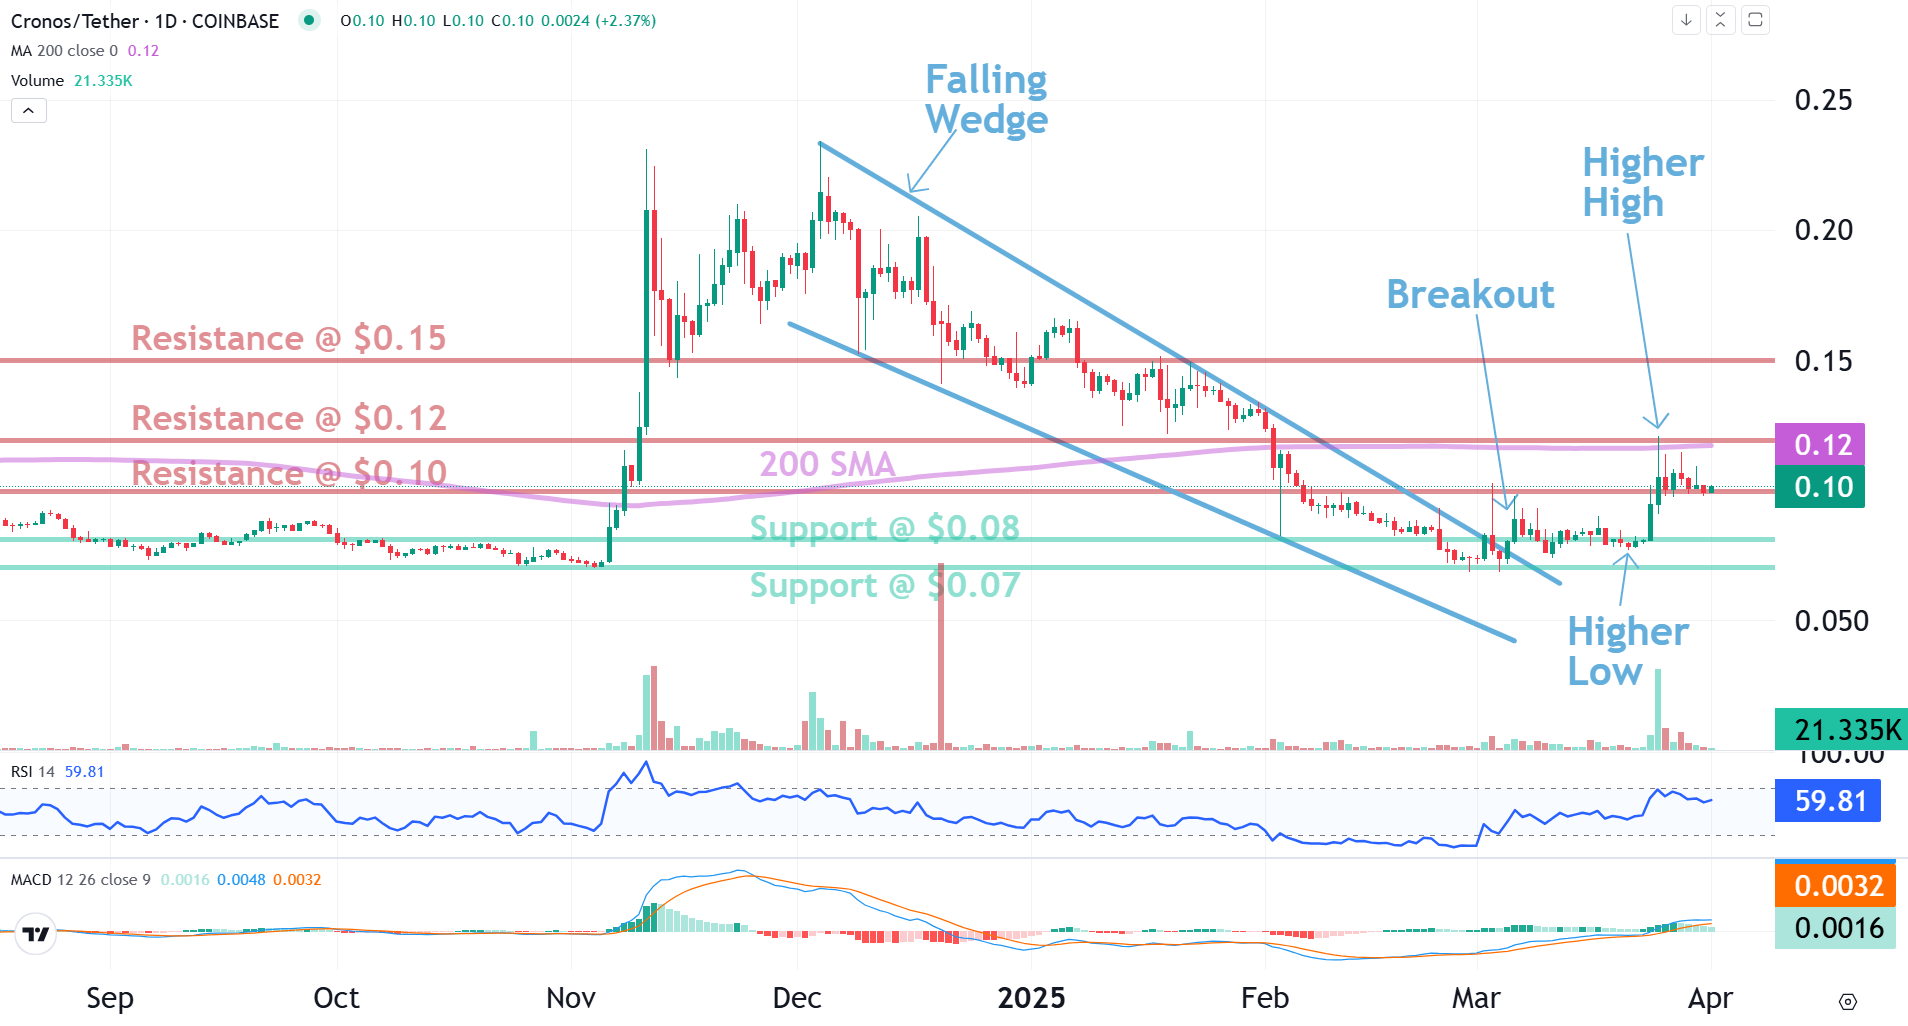
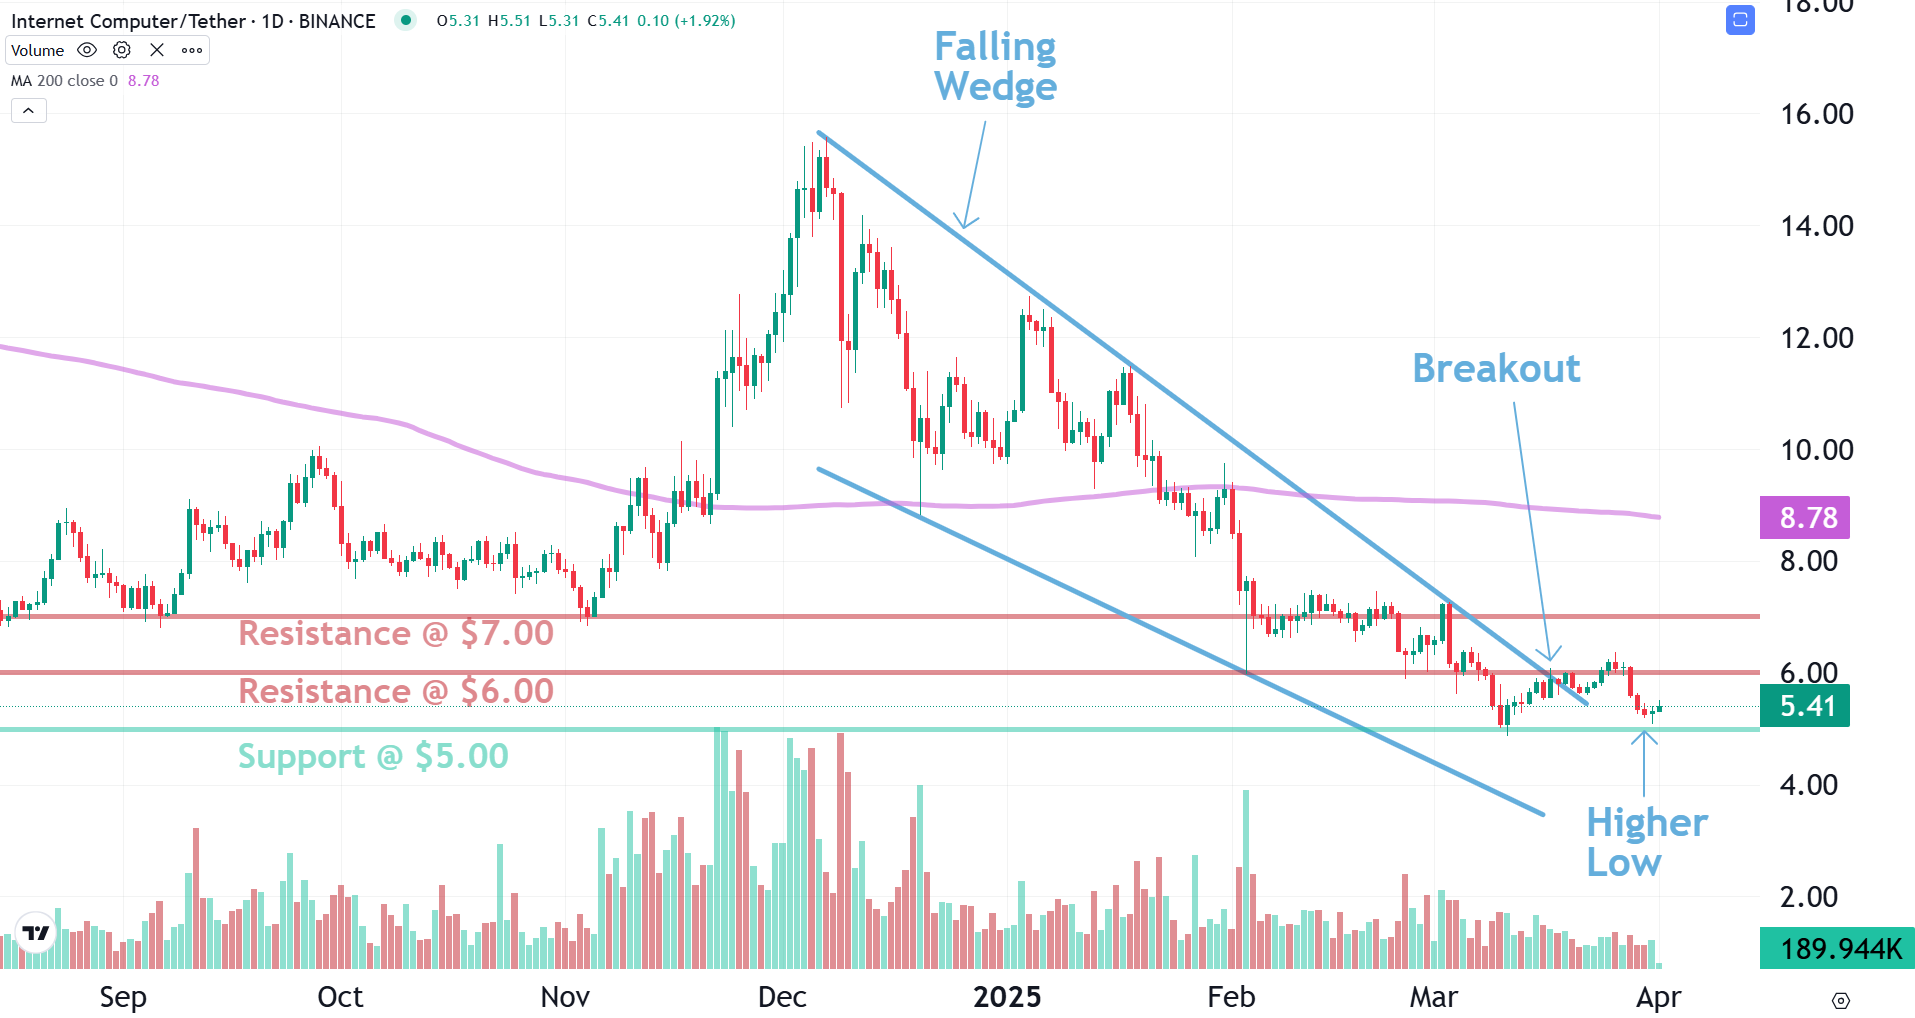
Our CEO shared a few key observations with VIP members today. In several assets, we’re seeing price breakouts from Falling Wedges or Channel Down patterns. After breaking out, these assets are pulling back to the breakout level or to a key support level.
If the price holds at that level and bounces (a shallow pullback), that creates a Higher Low, which is a bullish signal. If that bounce is followed by a Higher High, then we’re getting closer to a confirmed uptrend.
Here are two examples from this week:
- CRO (Cronos) – Formed a Higher Low and then a Higher High. That’s textbook bullish reversal behavior.

- ICP (Internet Computer) – Broke out and has pulled back. We’re watching to see if it bounces from support.
How to spot these early reversals faster?
With thousands of coins out there, it’s not realistic to scan each chart manually. That’s where altFINS comes in.
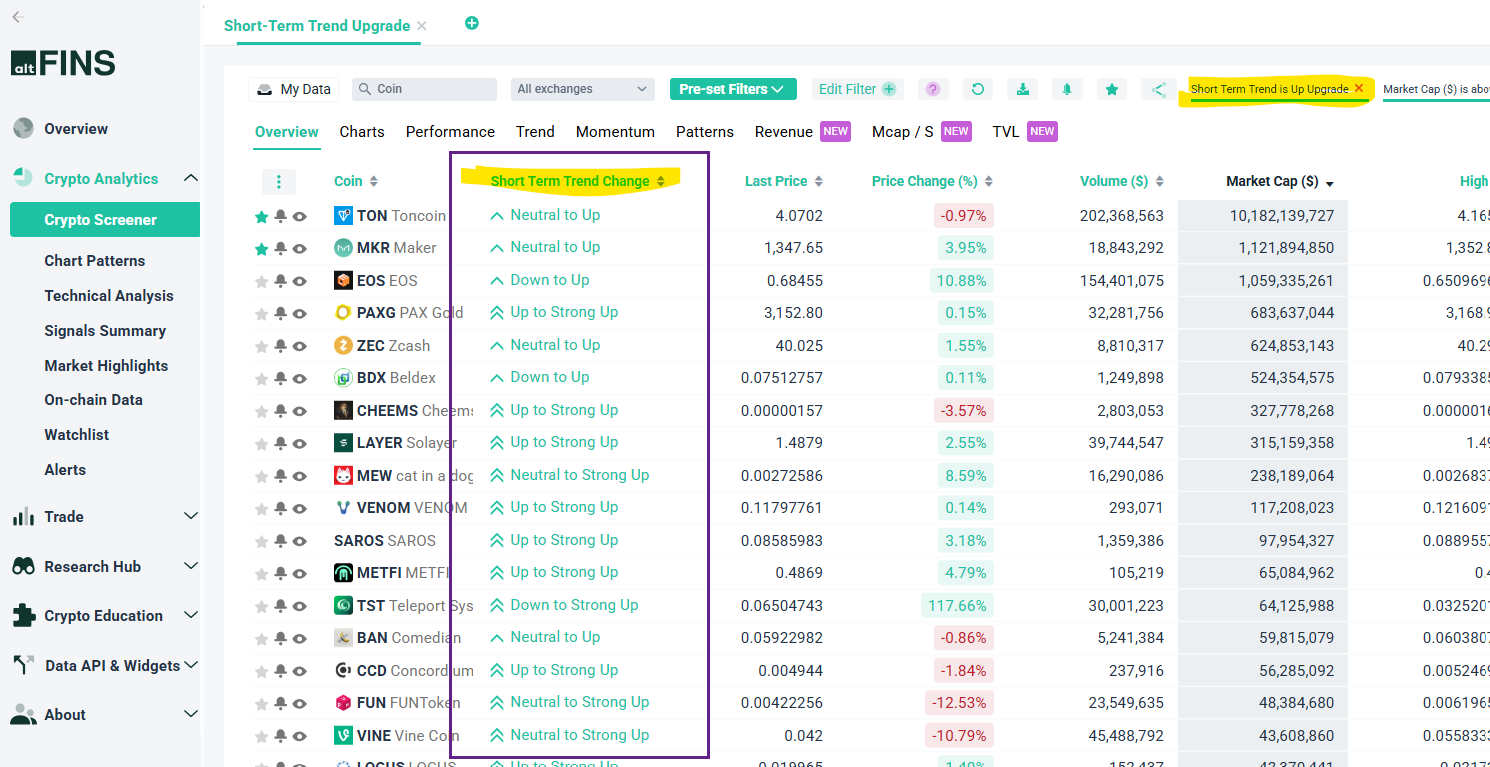
Our platform automatically scores the trend direction for over 3,000 assets across three timeframes: Short-Term, Medium-Term, and Long-Term.
One of the easiest ways to find potential reversals is to check which assets have recently had a Short-Term trend upgrade to “Up” or “Strong Up.”
Here’s where you can start:
- Screener: Short-Term Trend Upgrade
- Screener: Pre-Set Filter
In summary
The markets are still in a downtrend, but signs of a shift are appearing. Breakouts followed by shallow pullbacks, Higher Lows, and eventually Higher Highs are the signals to watch.
And instead of scanning for them manually, use altFINS’ tools to surface those opportunities automatically. Let the data guide you.
If you’d like to get updates like these in your inbox, make sure to subscribe to our VIP newsletter. Or come chat with us in our Telegram group.
Related Posts
-
Crypto Markets Performance rallied
The crypto markets performance are showing a strong increase. This trade setup has earned a…
-
Are crypto markets overbougth? Due for a pullback?
Crypto markets have rallied hard! Are crypto markets overbought? Over-extended? Our trade setups have generated…
-
Learn Trading Crypto with Richard
Learn trading crypto with Richard, CEO & Founder of altFINS. Watch his trade setups, technical analysis and…


0 Comments
Leave a comment