Crypto Technical Analysis API – Trade Setups
We now offer daily technical analyses for Bitcoin and 60+ altcoins via Technical Analysis API integration, helping you increase user engagement and differentiate your trading platform, app or website.
Boost Engagement, Trading Volume, and Retention
- Technical Analyses for 60+ Cryptocurrencies
- Provide traders with actionable insights for building strategies
- Trade Setup Insights
- Entry and exit strategies, trend analysis, momentum indicators, pattern recognition, and support/resistance levels
- Higher Engagement & Retention
- Differentiate Your Service
- Stand out by offering exclusive expert analysis
- More trading activity translates into higher revenue for your platform
Two-Week Demo Access Available!
Click here to learn more details.
Example of Technical Analysis: Bitcoin BTC
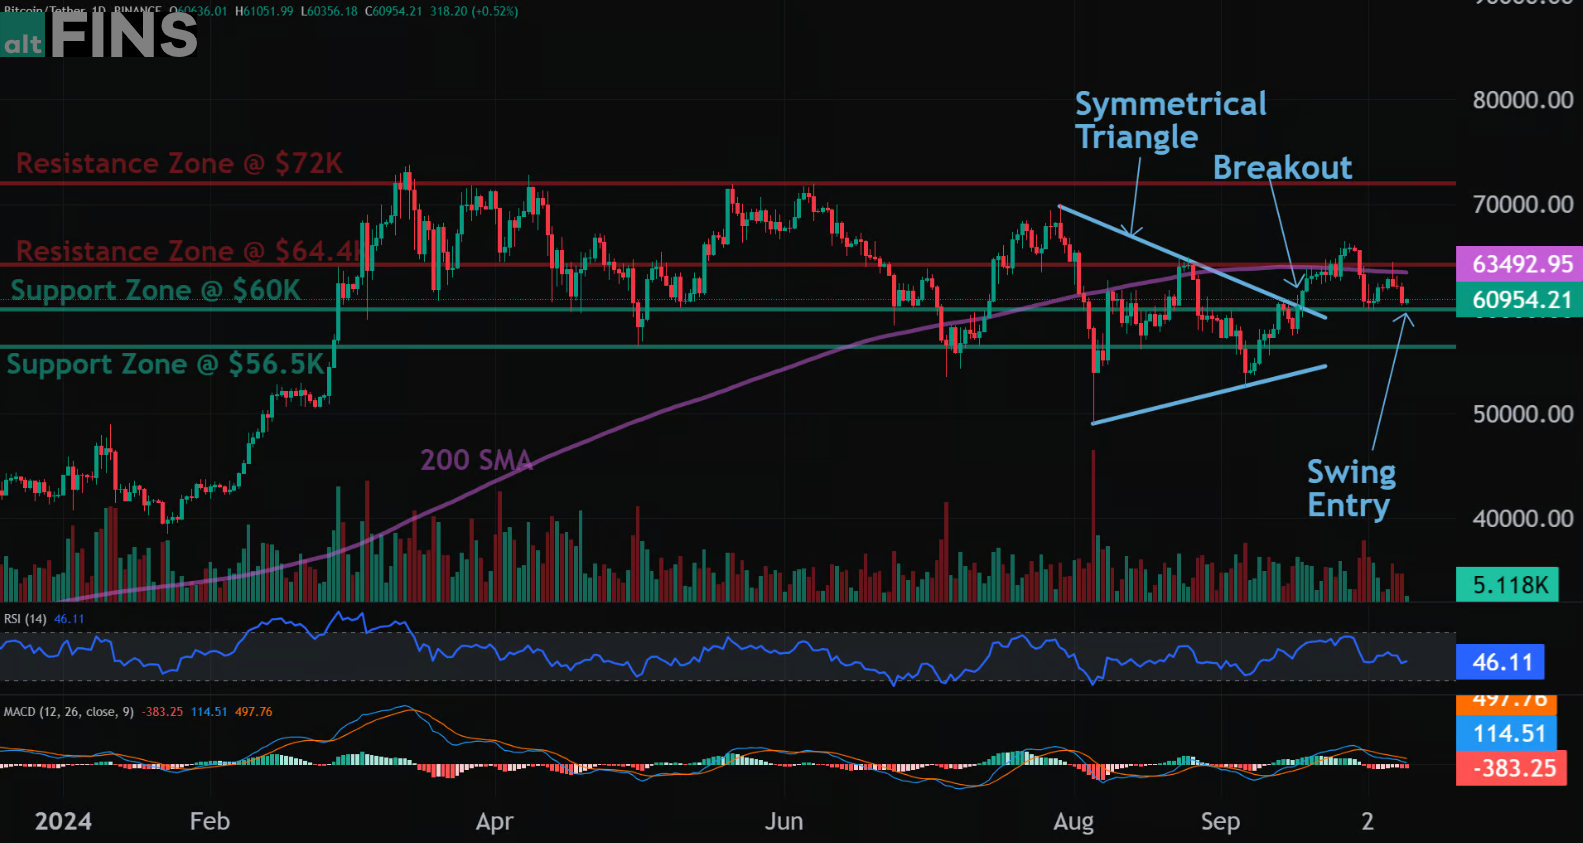
Bitcoin Trade setup: Trends are mixed but improving. Price broke above $60K resistance and out of Symmetrical Triangle pattern, and it successfully retested that breakout level. If price can break through the $64.4K resistance and 200-day moving average, it could revisit $72K next. We would be buyers if price 1) breaks above $64.4K resistance, or 2) pulls back to $60K support. Stop Loss at $57K.
Pattern: Price is Approaching Resistance, which is a level where it could pause or reverse its recent advance, at least temporarily. Resistance is often a level where price got rejected in the past, or potentially prior Support level that was broken. (concept known as polarity). Once price breaks above resistance, it can advance higher to the next resistance level.
Trend: Short-term trend is Down, Medium-term trend is Neutral, Long-term trend is Down.
Momentum is Bearish ( MACD Line crossed below MACD Signal Line) BELOW days ago. Price is neither overbought nor oversold currently, based on RSI-14 levels (RSI > 30 and RSI < 70).
Support and Resistance: Nearest Support Zone is $56,500.00, then $50,000.00. Nearest Resistance Zone is $72,000.00.
Interested in exploring more API and Widget options?
-
Market data (coins, time tickers, prices, price % changes, etc.)
-
Market data + Analytical data combines of over 300 values for each coin
Two-Week Demo Access Available!
Have any questions? Feel free to reach out to us at [email protected].
0 Comments
Leave a comment