Crypto Market Selloff! How Much Lower?
Crypto market correction has accelerated today, with BTC down -4.60% and ETH down -6.20%.
Other altcoins followed suit. Naturally, traders are asking:
1. Could I have seen this coming?
2. How much lower can we go?
3. Is my portfolio at risk?
4. What should I do now?
5. How to protect myself in the future from such drawdowns?
Let’s unpact these questions and provide some quick answers
1. Could I have seen this coming?
Yes and no.
We can’t see the future.
But when prices are overbought near their resistance, start breaking below support or have bearish breakouts from chart patterns, we better get out of the way, or Sell Short.
Here’s an example in our Trade Setups.
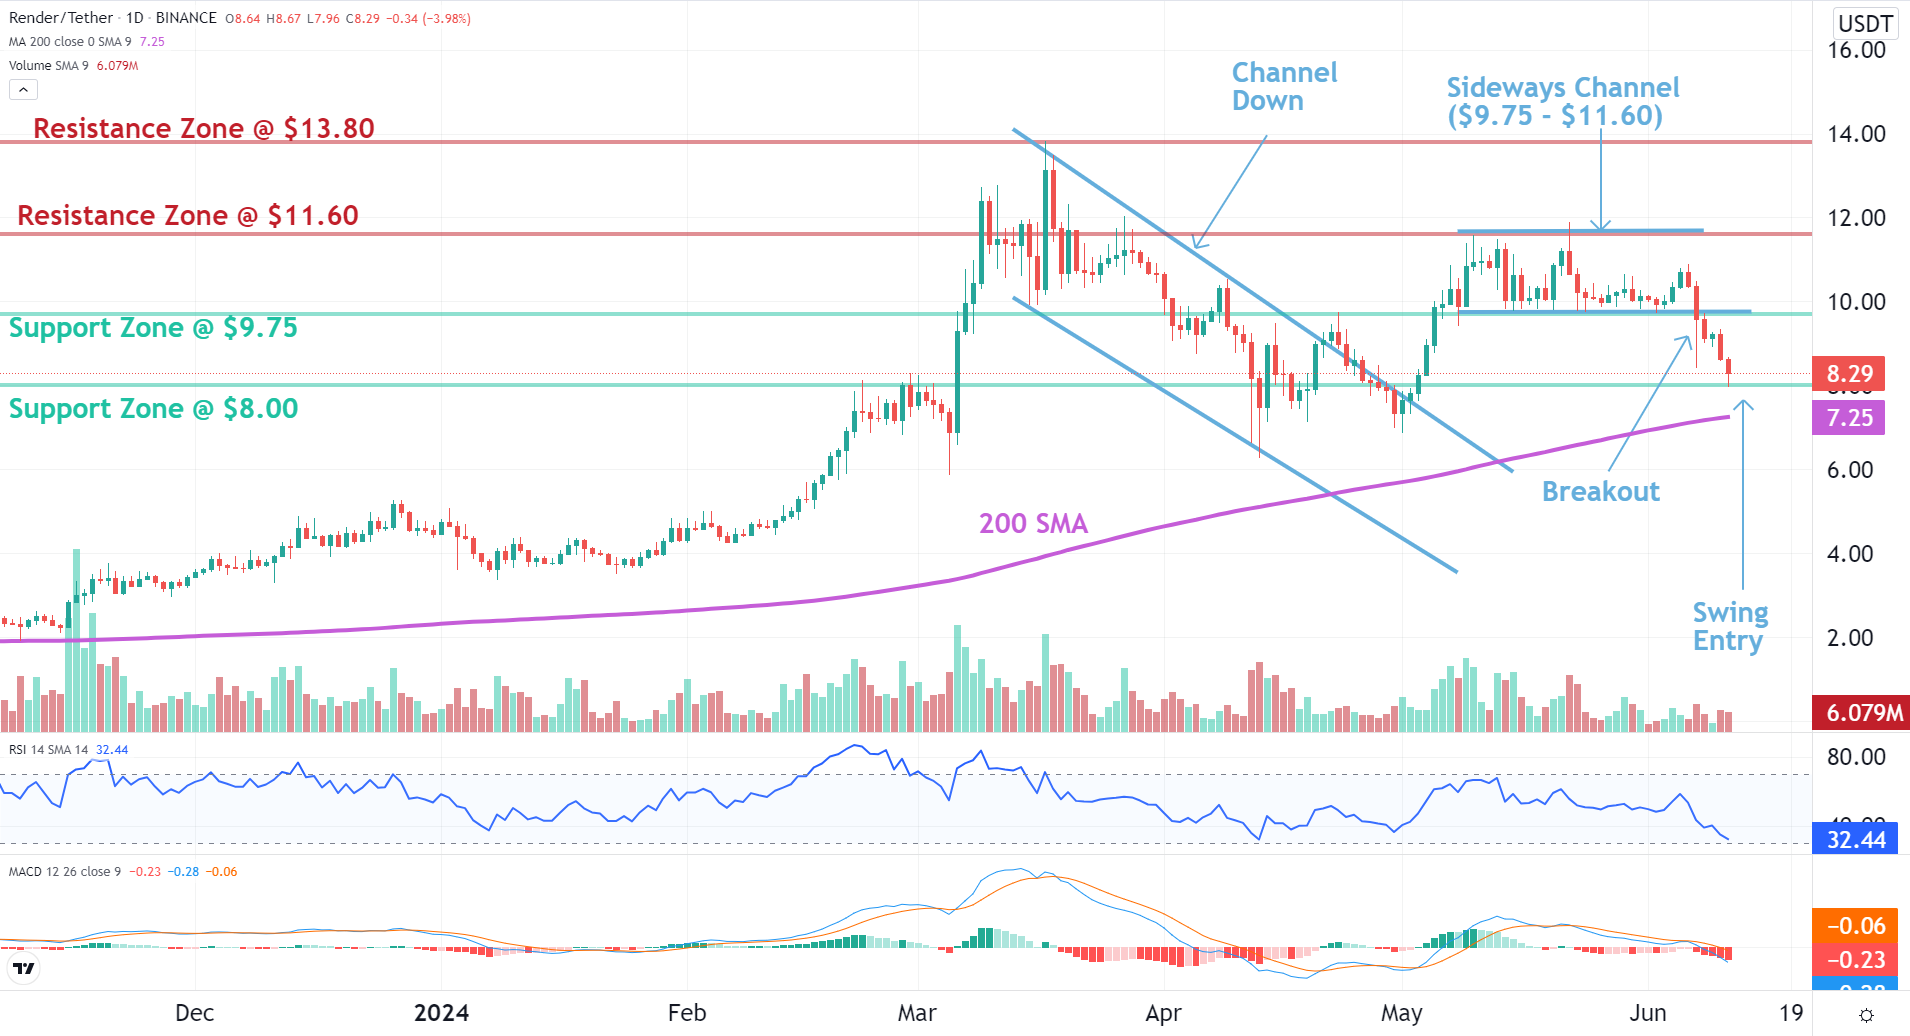
RNDR (Render) had a bearish breakout from Sideways Channel, below the $10 support.
Clearly sellers were winning. Better get out of the way…
Source: altFINS
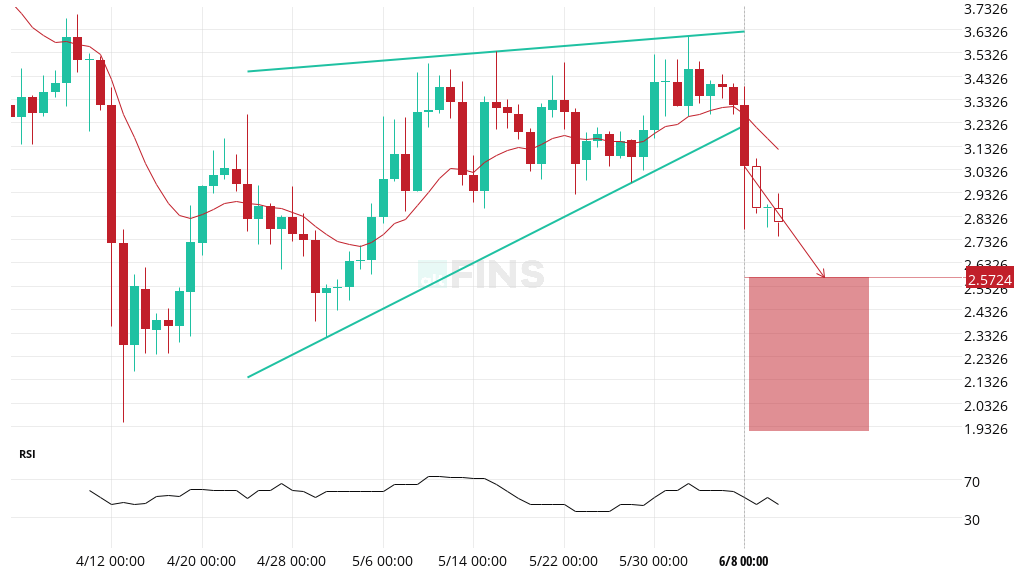
Another example is RLC.
Our automated Chart Patterns detection system identified a bearish breakout from Rising Wedge pattern three days ago and predicted a further decline.
Source: altFINS
2. How much lower can we go?
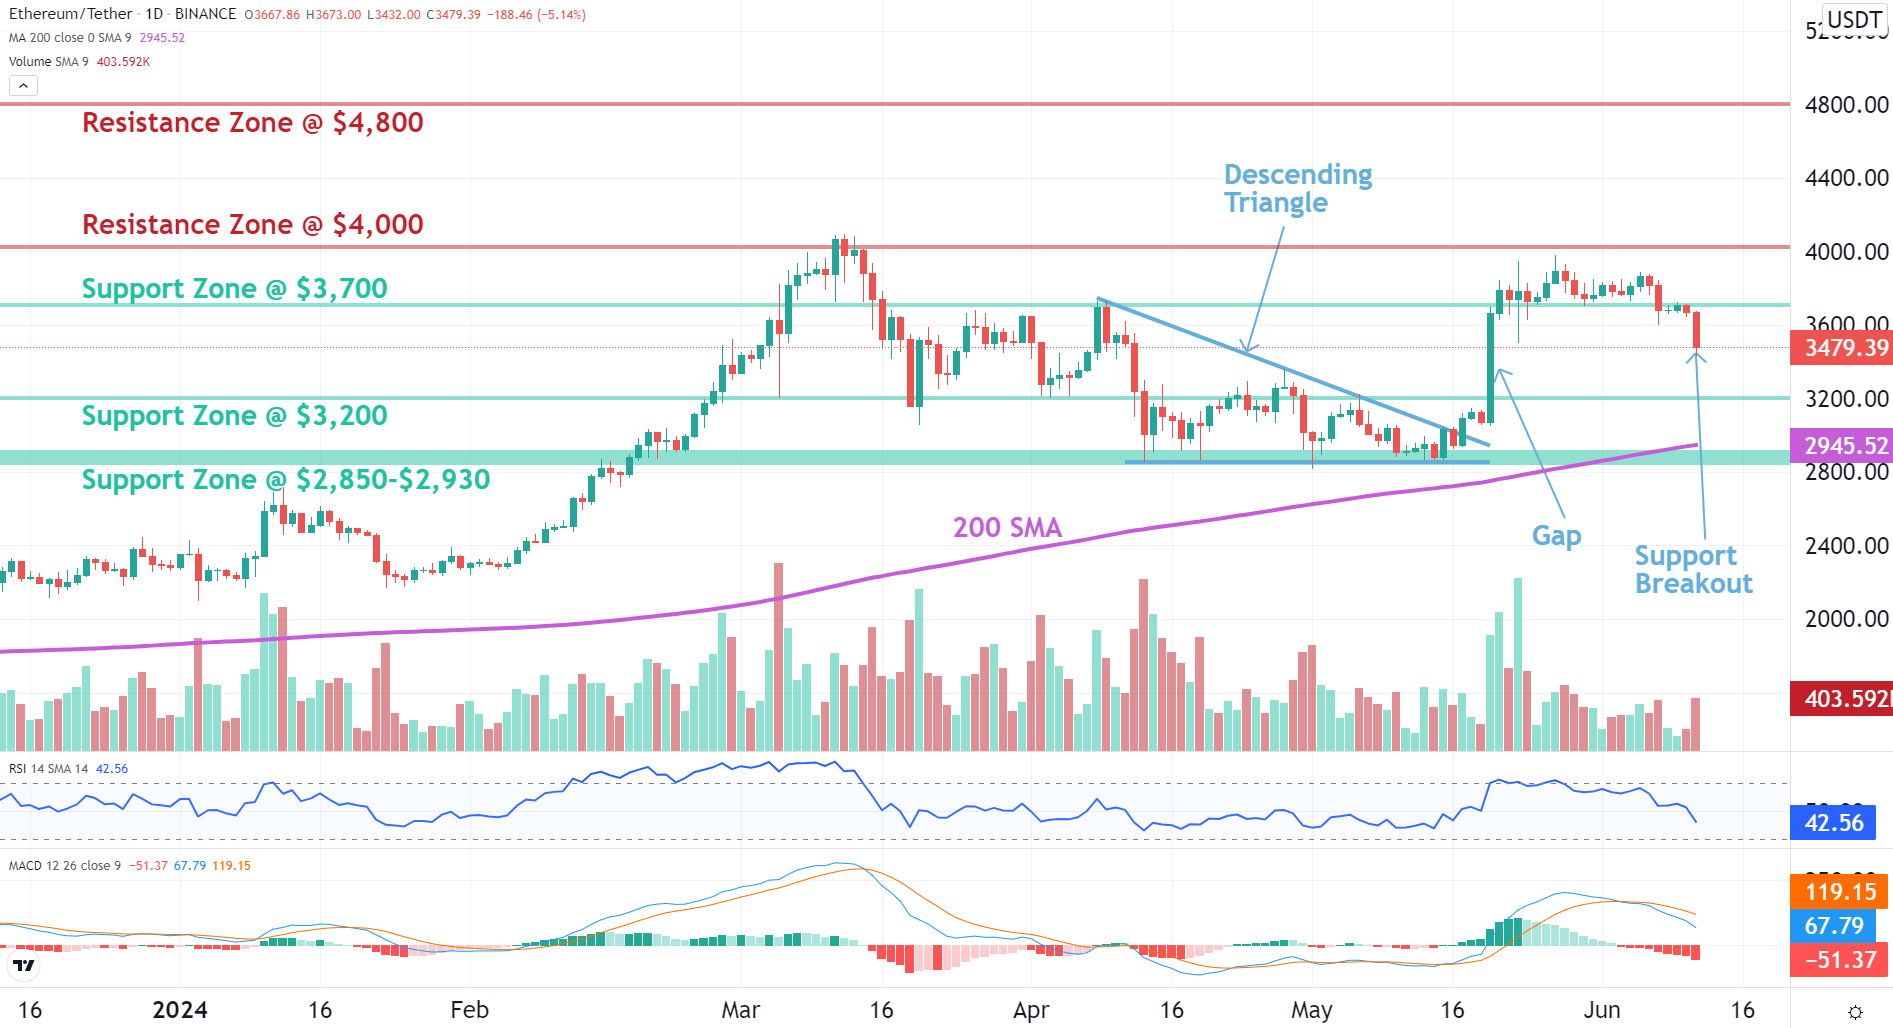
For Ethereum (ETH), the next support area is around $3,200, which is another 7-8% decline from current $3,450 level.
And it’s not even oversold yet…there’s potentially more pain ahead in the near-term.
ETH gapped up on May 20th, shortly before the surprising SEC approval of ETH Spot ETFs.
That gap is likely to get filled. That’s common wisdom among traders: gaps get filled.
Which means that ETH could retrace its big move back to $3,200, the nearest support.
Other altcoins will follow. At a minimum, prices tend to revisit their prior support levels.
We highlight Support and Resistance for assets in our Trade Setups.
Understading Support and Resistance is a key pillar of Technical Analysis (TA) that we teach in Lesson 3 of our new Crypto Trading Course.
In fact, some traders make a living simply by trading around Support and Resistance.
ETH (Ethereum) – Technical Analysis. Will the Gap Get Filled?
Source: altFINS
3. Is my portfolio at risk?
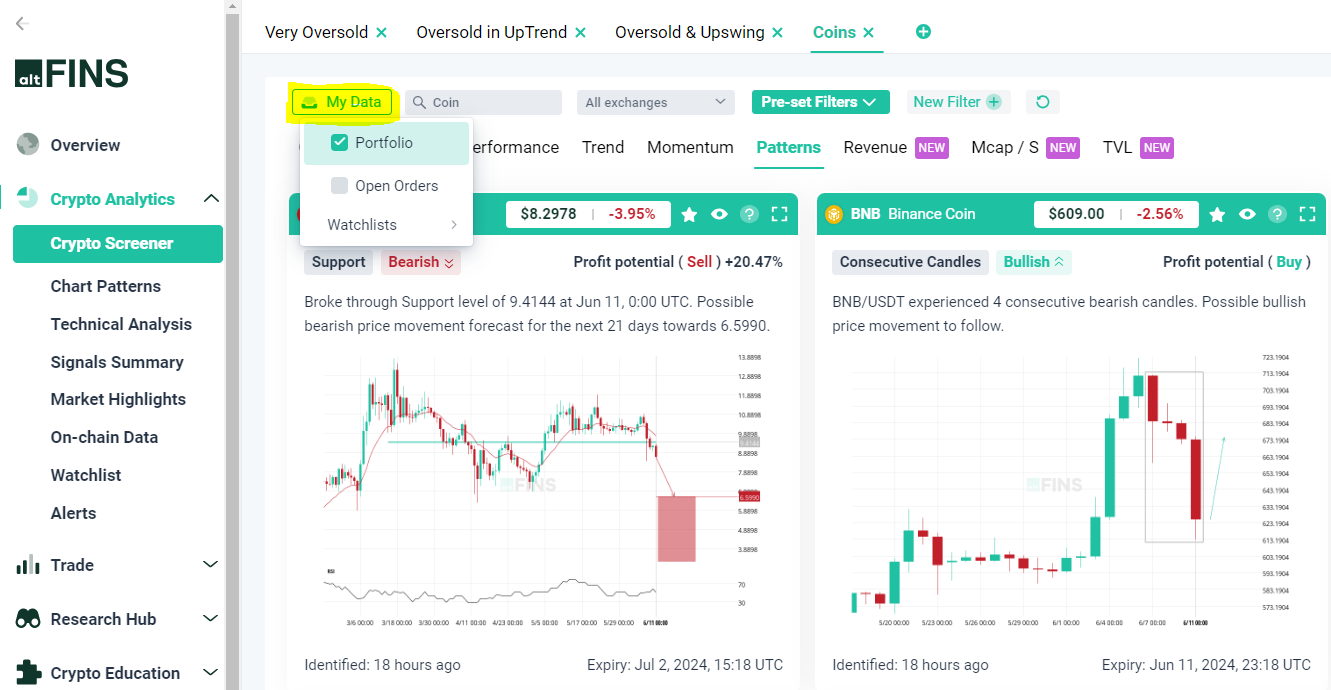
With altFINS, you can easily check the signals, chart patterns, trade setups, trends and momentum for all assets in your portfolio or watchlist.
Use the “My Data” filter option:
You can create trade signal alerts just for assets in your portfolio or wathclist. Here is how.
4. What should I do now?
Assuming you didn’t blow up your account with excessive leverage…
There are going to some attractive buying opportunities in the next couple of days.
We will identify them using altFINS trade discovery tools:
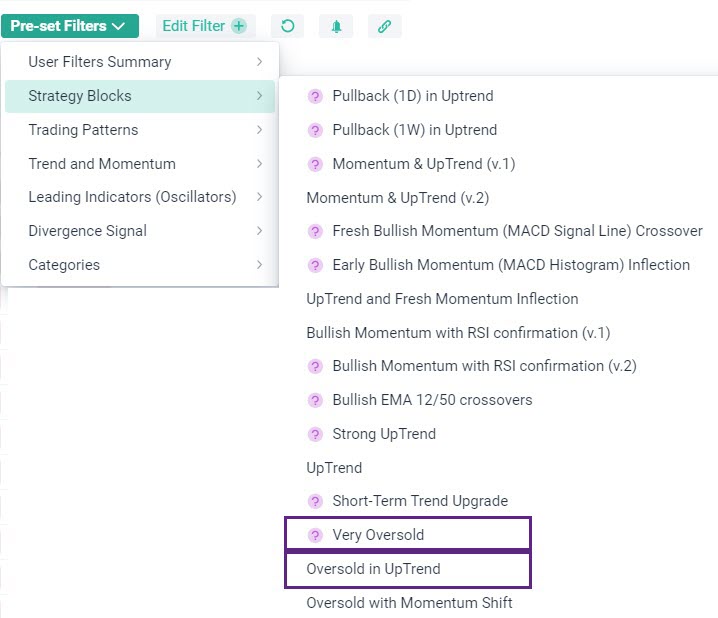
- Screener pre-set filter: Oversold in Uptrend – finds assets that are still in an Uptrend but are oversold (RSI < 40), due for a bounce. (see live results)
- Screener pre-set filter: Very Oversold – finds assets that are extremely oversold (RSI < 25) and due for a bounce, regardless of trend. (see live results)
- Trade Setups: Pullback in Uptrend – finds assets that are in an Uptrend and have pulled back to their support zones.
You can find these strategies on the Screener in our Pre-Set Filters:
5. How to protect myself in the future from such drawdowns?
We already mentioned that traders must pay attention to price action: assets overbought (RSI > 70) near their resistance, breaking below support or bearish breakout from patterns.
In addition, traders must have risk management in place: Stop Loss levels, appropriate trade size, and avoid leverage.
Learn risk management techniques in Lesson 9 of our Crypto Trading Course.
0 Comments
Leave a comment