


Bitcoin Slides as Treasury Yields Hit Their Highest Since 2007: Key Levels to Watch

Bitcoin slid to $83,487 today as Treasury yields hit their highest level since 2007. Here are the levels that matter, why altcoins fell harder, and what the altFINS data says about the trend.
Bitcoin is down 3.08% today at $83,487, after being rejected at $87,395 on September 21 and again near $87,277 on September 23. According to, a rebound in oil, the strongest US business survey in five years and a poorly received five-year note sale pushed Treasury yields to their highest level since 2007, and Dogecoin fell 8%.
This article maps Bitcoin’s support and resistance levels, shows how far the largest altcoins pulled back and whether their trends held, and checks in on Bitcoin Cash after yesterday’s CME-driven spike.
⚡ Quick Take
Bitcoin is $83,487 (-3.08% today, +9.52% this week, RSI 60, Strong Up), rejected twice near $87.4K as Treasury yields hit a 2007 high. The ten hardest-hit coins above $500M market cap fell roughly 9% to 12.5%, yet nine of them are still rated Up or Strong Up short-term. Key levels: support at $82,258 and then $74,953; resistance at $87,395, with the altFINS analyst desk eyeing $90,000.
Why Bitcoin Fell: Treasury Yields at a 2007 High
Bitcoin slipped under $84,000 as the bond market sold off. A rebound in oil, the strongest US business survey in five years and a poorly received five-year note sale pushed borrowing costs higher, taking Treasury yields to their highest level since 2007. Higher yields raise the return on holding cash and bonds, which tends to put pressure on risk assets such as crypto.
There is a counterweight. Bitcoin ETF inflows stayed positive for a fifth straight session even as BTC reversed from above $86,000. The trend data has not cracked either: altFINS still rates Bitcoin Strong Up (10/10) on both the short and medium term, and RSI14 has cooled from about 67.5 yesterday to about 60 today.
Bitcoin Was Rejected at $87,400 Twice in Three Days
Daily candle data from the altFINS OHLC feed shows Bitcoin’s high on September 21 was $87,395 and its high on September 23 was $87,277, essentially the same ceiling. The altFINS screener marks $87,395 as the nearest resistance. Two failed tests in three days tell you sellers are defending that level, but neither rejection has broken the structure: price is still above $82,258, the former resistance Bitcoin cleared on September 21, which now acts as support under the polarity principle.
Altcoin Pullbacks: Hit Hard, Trend Intact
The ten hardest-hit coins above $500 million in market cap fell between about 9% and 12.5% today, led by Uniswap (UNI, -12.48%), Pepe (-12.16%) and OFFICIAL TRUMP (-11.21%). Nine of the ten are still rated Up or Strong Up on the short-term trend; only OFFICIAL TRUMP (Down, 4/10) is not. The altFINS pullback-in-uptrend scan (SB_PULLBACK_1D_UPTREND) currently lists more than 100 coins, which is what a broad pullback inside an uptrend looks like. Here is how the majors stack up, with live data from the altFINS screener:
| Coin | Price | 1D | 1W | RSI 14 | Trend |
|---|---|---|---|---|---|
| BTC — Bitcoin | $83,487 | -3.08% | +9.52% | 60.3 | Strong Up |
| ETH — Ethereum | $2,663 | -2.89% | +10.16% | 60.3 | Strong Up |
| XRP — XRP | $1.48 | -8.04% | +13.84% | 55.6 | Strong Up |
| AVAX — Avalanche | $10.11 | -9.24% | +35.26% | 63.6 | Strong Up |
| LINK — Chainlink | $12.26 | -5.55% | +10.89% | 53.5 | Strong Up |
| UNI — Uniswap | $9.13 | -12.52% | +35.99% | 66.3 | Strong Up |
Which Pullbacks Look Least Stretched?
An uptrend rating describes trend direction, not timing, so RSI14 and the nearest levels help show how much room each coin has. These are levels to watch, not signals to act on.
LINK, RSI 53.5: The least stretched of the group after a 5.55% drop. Nearest support is $10.616 (the 50-day average sits at $10.99) and nearest resistance is $13.293.
XRP, RSI 55.6: Down 8.04% and trading just under $1.4927 resistance, with $1.6997 above it. Nearest support is $1.2475.
AVAX, RSI 63.6: Resistance at $10.487 and then $11.797; support at $8.1995, with the 200-day average at $8.0283.
UNI, RSI 66.3: Still the highest RSI of the group even after a 12.52% drop and a 35.99% weekly gain, and its nearest support ($4.575) sits far below the current price.
Bitcoin Cash: Yesterday’s Spike, Today’s Pullback
CME Group will launch regulated Bitcoin Cash and Uniswap futures on October 19, which sent BCH up more than 28% yesterday on 5.5x its normal volume. Today BCH is $331.85 (-8.07%, RSI 69.1), still above its 200-day average of $314.74. altFINS’ read after that move was to wait for a pullback rather than chase; the zone between $266 (old resistance) and $315 (the 200-day average) has not been tested, and a daily close below $266 would invalidate the breakout.
Bitcoin (BTC) Price Prediction: Technical Chart Analysis
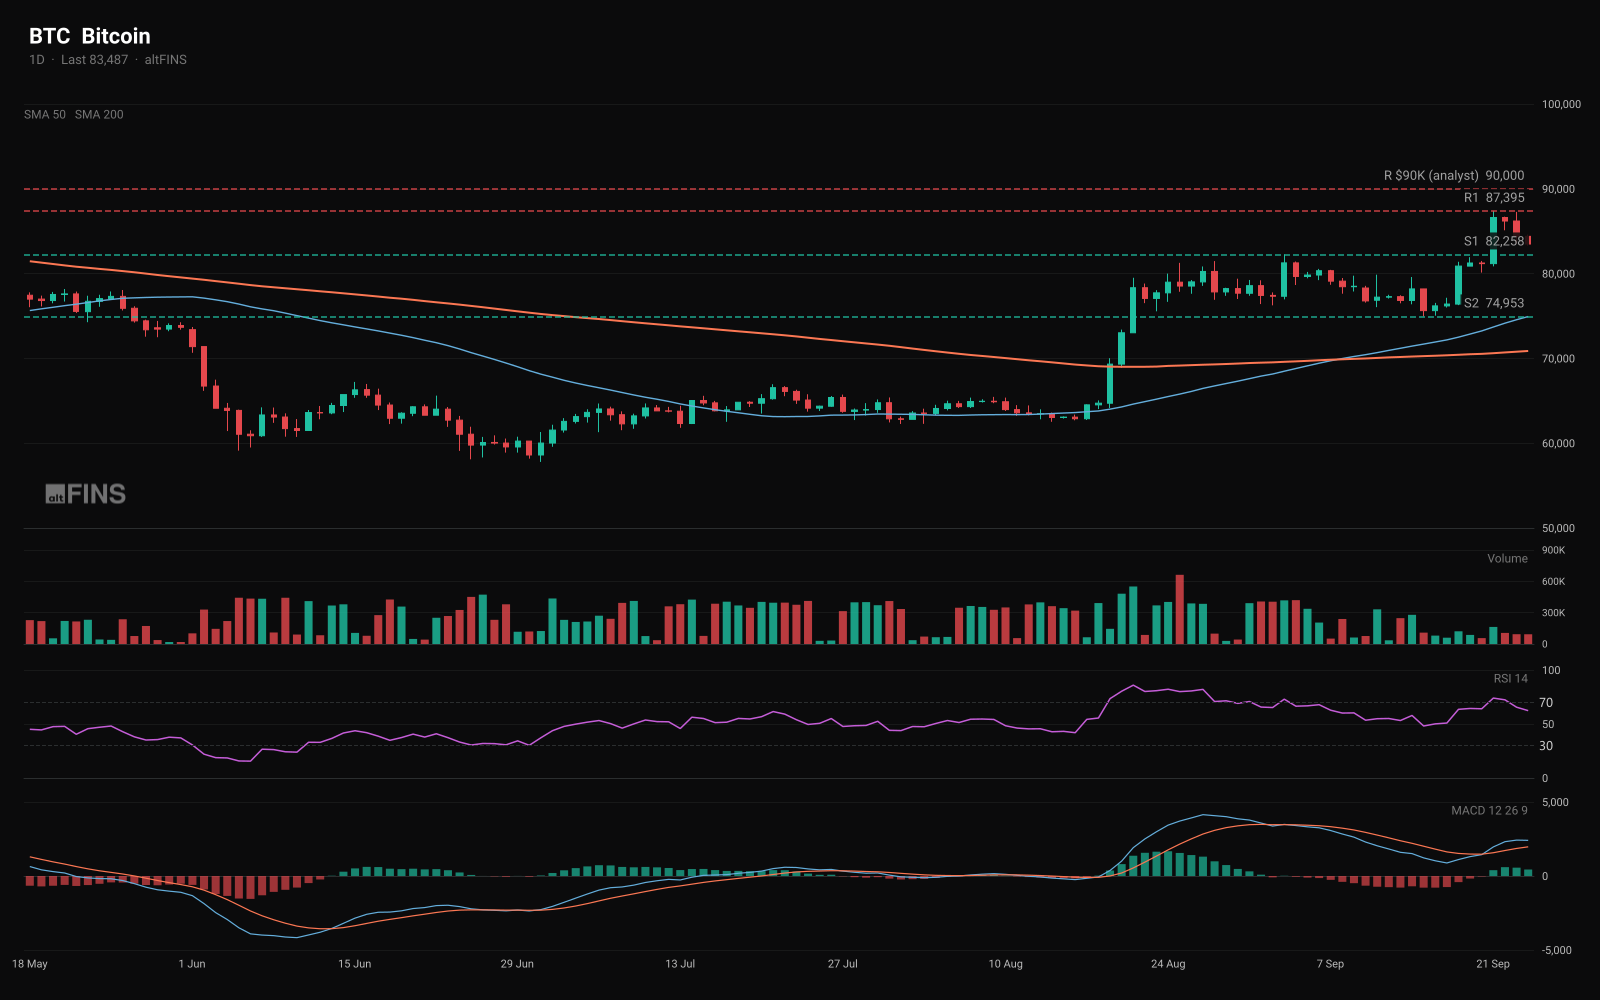
Three scenarios frame the next move, using the altFINS screener levels and the analyst desk’s read:
- Holds $82,258: a retest of $87,395 comes next. A break above it opens the analyst targets at $90,000 and then $97,000.
- Loses $82,258: the next support is $74,953, which lines up with the 50-day average at about $74,937.
- Closes a day below $74,953: the uptrend thesis is in question, with $70,000 and the 200-day average near $70,877 next.
The altFINS analyst desk rates Bitcoin’s near-term outlook Bullish after the breakout above $83,000, but notes that MACD histogram bars are declining, which suggests momentum may have peaked. That makes $87,395 a level to watch rather than one to chase.
📌 Key Takeaways
- Bitcoin is $83,487 today (-3.08%, RSI 60) after Treasury yields hit their highest level since 2007, per CoinDesk.
- BTC was rejected at $87,395 on September 21 and near $87,277 on September 23; that zone is the nearest resistance.
- Support levels: $82,258 first, then $74,953 (on the 50-day average); a daily close below $74,953 puts the uptrend in question.
- Nine of the ten hardest-hit coins above $500M market cap (down roughly 9% to 12.5%) are still rated Up or Strong Up short-term.
- Bitcoin Cash gave back 8.07% to $331.85 after yesterday’s CME-driven spike and remains above its 200-day average of $314.74.
Frequently Asked Questions
Why is Bitcoin falling today?
Bitcoin fell 3.08% to $83,487 as Treasury yields rose to their highest level since 2007. According to CoinDesk, a rebound in oil, the strongest US business survey in five years and a poorly received five-year note sale pushed borrowing costs higher. Bitcoin had also been rejected at $87,395 on September 21 and near $87,277 on September 23.
What are Bitcoin’s key support and resistance levels right now?
On the altFINS screener, the nearest resistance is $87,395, and the analyst desk lists $90,000 and then $97,000 above it. The nearest supports are $82,258 and $74,953, with $70,000 and the 200-day average near $70,877 below that. A daily close under $74,953 would put the uptrend thesis in question.
Are altcoins still in an uptrend after today’s drop?
Mostly, yes. The ten hardest-hit coins above $500 million in market cap fell roughly 9% to 12.5% today, but nine of the ten are still rated Up or Strong Up on the short-term trend on altFINS. The altFINS pullback-in-uptrend scan lists more than 100 coins right now.
See which coins are pulling back inside an uptrend right now, with live support and resistance levels for each, on the altFINS screener.
👉 Open the Free Crypto Screener on altFINS →
Disclaimer: This article is for education and information only. It is not financial advice, not a recommendation to buy or sell any asset, and not a solicitation. Crypto is highly volatile and you can lose your entire capital. Always do your own research. altFINS and its team may hold positions in assets mentioned.
Related Posts


 Written byLenka Fetyko
0 Comments
Leave a comment