Bitcoin Market Analysis – March 31, 2025

Bearish Momentum Persists as BTC Faces Key Resistance
Bitcoin (BTC) has entered a critical phase after retracing sharply from its all-time high in January. The current price stands at $82,281.50, marking a 1.18% decline over the last 24 hours and a 4.33% drop over the past week. Technical and on-chain metrics both point to caution, with a mixture of oversold signals, declining revenue, and macro trend weakness.
This analysis provides a complete breakdown of Bitcoin’s price structure, technical indicators, and on-chain health to assess whether this is a time to buy, hold, or stay on the sidelines.
Price Summary
- Current Price: $82,281.50
- 24H Change: -1.18%
- 7D Change: -4.33%
- From All-Time High (Jan 20, 2025): -24.85%
- Market Cap: $1.64 trillion
- Volume (24H): $2.88 billion
- ATH Price: $109,492.88
Support Zone: $72,000 – $74,000
Resistance Levels: $90,000, $100,000, $108,000
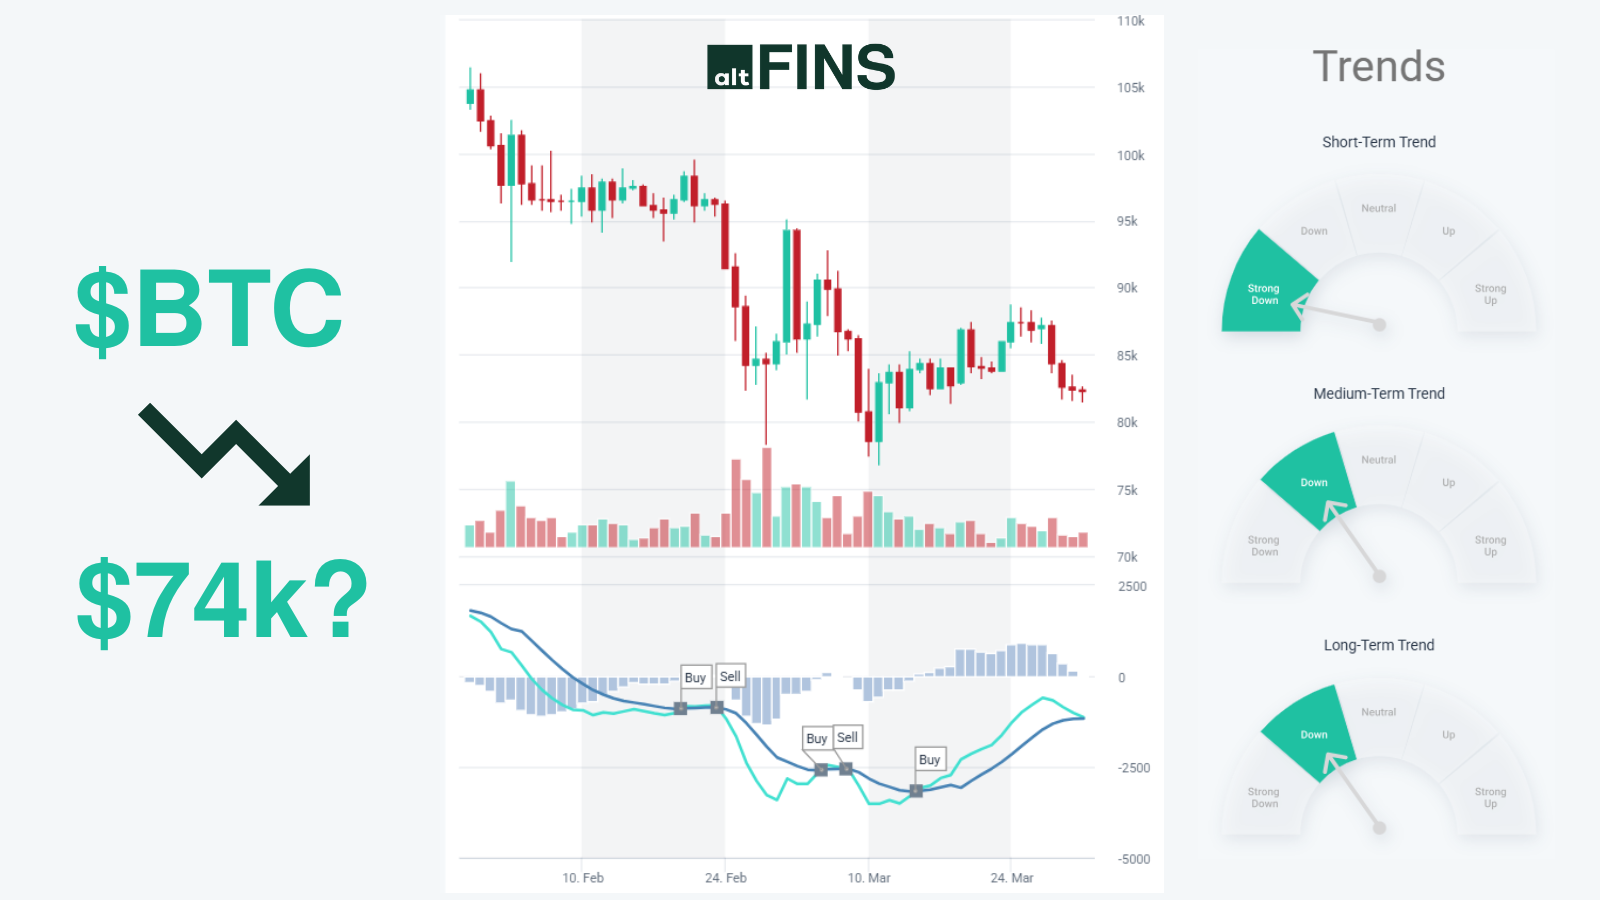
Trend Overview
Bitcoin’s current market structure reflects weakness across all key timeframes:
- Timeframe Trend
- Short-Term Strong Down
- Medium-Term Down
- Long-Term Down
The trend indicators are aligned to the downside, suggesting that bears remain in control.
Technical Indicators
Moving Averages
The majority of short- to mid-term SMAs and EMAs (5–50 period) are trending downward.
Long-term MAs (100 and 200) are still rising but BTC is trading below them, a warning sign that broader support is being tested.
Oscillators
- RSI (14): 41.73 – Neutral, but below the 50 centerline, indicating bearish momentum.
- Stochastic RSI & Williams %R: Oversold – indicating potential for a short-term bounce.
- MACD: Bullish crossover recently occurred, offering slight near-term positive momentum.
- Momentum and Ultimate Oscillator: Bearish – suggests any bounce may be weak or short-lived.
Overall, the indicators signal bearish conditions with early signs of potential recovery, though confirmation is lacking.
Chart Pattern Analysis
A daily timeframe chart reveals several key developments:
- Double Top Formation at the all-time high around $109,000 has triggered a major reversal.
- Price has retraced to fill a gap between $74,000 and $90,000.
- Bitcoin is now approaching a descending resistance trendline near $90,000.
- The 200-day Simple Moving Average (SMA) is acting as resistance after being broken.
- RSI is neutral at 48.94, and MACD momentum is weakly bullish.
If price breaks above $90,000 with confirmation (strong volume, RSI > 50, and MACD support), a trend reversal could be initiated. Failing that, the next downside target lies in the $72,000–$74,000 support zone.
Go to Chart Patterns to see the current BTC Chart Pattern analysis.
On-Chain Revenue Analysis
A crucial component of Bitcoin’s valuation is its network revenue, which reflects blockchain usage, miner income, and transaction demand.
Revenue Growth Rate, Period Change:
- 1D -32.88%
- 7D +33.54%
- 30D -4.89%
- 90D -50.62%
- 180D -44.79%
- 365D -67.47%
While the 7-day growth is positive, the longer-term revenue trend is significantly negative, suggesting a sustained decline in network activity.
Market Cap / Total Revenue Ratio (Mcap/TR), Period Change
- 30D +3.28%
- 180D +249.75%
- 365D +2,283.69%
The surge in Mcap/TR indicates that Bitcoin’s market cap has increased disproportionately to its revenue, a sign of overvaluation from a fundamental perspective.
Check out more Bitcoin on-chain data.
Outlook and Strategy
Bitcoin’s current setup is a complex mix of technical weakness and overextended valuation. Here’s how different market participants might approach the situation:
- Short-Term Traders: Avoid aggressive long positions unless price breaks above $90,000 with confirmation. There is room for a relief rally, but momentum remains limited.
- Despite overall weakness and a likely capitulation ahead, extreme negativity, oversold conditions, and key support levels suggest a potential short squeeze pushing BTC above $90K—provided it reclaims the crucial $84K level.
- Swing Traders: Remain patient until BTC either breaks out above the descending resistance line or revisits the support zone around $74,000. The market is in a decision phase.
- Long-Term Investors: While BTC is down ~25% from its ATH, revenue metrics suggest caution. A dollar-cost averaging (DCA) approach may be appropriate for those with a long-term thesis, but accumulating at current levels carries risk unless network activity rebounds.
Conclusion
Bitcoin is in a bearish technical phase, with declining revenue adding further weight to the downside pressure. While short-term indicators show potential for a bounce, there is no confirmation of a sustainable reversal. Traders and investors should remain cautious and focus on key levels:
- Watch for a breakout above $90,000 as a potential trend reversal.
- Monitor support around $72,000–$74,000 for possible re-entry or bounce.
- Track on-chain revenue recovery to support long-term valuations.
Until these signals align, capital preservation and tactical positioning remain the most prudent strategies.
More Bitcoin (BTC) data, news, and events here!
0 Comments
Leave a comment