


Aave (AAVE) Price Retests $162 After the Tokenized-Stock Spike. Buy Zone or Failed Breakout?

On Tuesday, Aave became one of the first places where you can borrow dollars against tokenized Apple and Nvidia shares, and AAVE ripped to $176. A day later it’s back at the level it broke out from. That’s either the entry traders were waiting for, or the start of a failed breakout.
Aave (AAVE) closed September 29 up 10.6% at $165.28 after touching $176.26 intraday, clearing $162, the resistance level the altFINS analysts had been watching. Today it has pulled back to $160.54, down 4.03% on the day and 8.9% below that high.
That puts AAVE right on top of its breakout level. The trend scores haven’t flinched, though: short-, medium- and long-term trends are all rated Strong Up (10/10) on the altFINS screener, and RSI has cooled from overbought to 63.7.
⚡ Quick Take
AAVE: spiked to $176.26 on September 29 on the Aave V4 tokenized-stock launch, now $160.54 (−4.03% today, +8.44% this week, RSI 63.7). It is retesting the $162 breakout level. From here: +12.1% to the $180 target and +24.6% to $200, against −10.9% to the $143 stop. What confirms it: a daily close back above $162. What breaks it: a daily close below $143.
What’s Driving Aave (AAVE) This Week
Aave V4 has launched an Equities Hub on Base that accepts tokenized shares of Apple, Amazon, Alphabet, Meta, Microsoft, Nvidia and Tesla. The tokens are issued by Coinbase and are collateral-only at launch: eligible non-US users deposit them and borrow USDC against them, within initial borrowing caps. Chainlink supplies the price data.
It’s a real use case. Coinbase tokenized stocks recently passed $1 billion in trading volume on Base, and lending against them gives those tokens a job beyond trading. Aave is the protocol capturing that first.
So why the pullback? Some of it is normal profit-taking after a 2x-ATR candle; the altFINS signal feed flagged an overbought Stochastic and an Unusual Volume Decliner overnight. And there are real risks to price in:
- Weekend pricing gap. Stock markets close on weekends, and the collateral price feeds hold Friday’s value until Monday, which exposes USDC lenders if a stock gaps at the open.
- Regulation. Today is the EU’s September 30 deadline on its MiCA review of DeFi lending.
- Macro. US PCE inflation, the Fed’s preferred gauge, is out today, and it could set the tone for crypto and stocks into the fourth quarter.
DeFi Coins by the Numbers: Live altFINS Data
AAVE and LINK are giving back part of Tuesday’s move, while other DeFi names are holding up. Here are the major DeFi and oracle coins, with Bitcoin and Ethereum for context, from the altFINS screener:
| Coin | Price | 1D | 1W | 1M | RSI 14 | Trend |
|---|---|---|---|---|---|---|
| AAVE — Aave | $160.54 | -4.03% | +8.44% | +26.64% | 63.7 | Strong Up |
| LINK — Chainlink | $14.38 | -6.20% | +10.23% | +25.52% | 62.1 | Strong Up |
| ENA — Ethena | $0.2611 | +4.11% | +20.61% | +63.57% | 69.4 | Strong Up |
| SKY — Sky | $0.0816 | +1.49% | +17.75% | +19.36% | 66.4 | Strong Up |
| UNI — Uniswap | $8.831 | -1.73% | -13.63% | +88.62% | 58.7 | Up |
| MORPHO — Morpho | $2.592 | +1.65% | -1.53% | +7.59% | 53.3 | Up |
| BTC — Bitcoin | $83,494 | -0.41% | -3.14% | +6.73% | 58.7 | Up |
| ETH — Ethereum | $2,687 | -0.65% | -2.43% | +9.32% | 61.4 | Up |
Every coin in the table still has at least an Up short-term trend, and all four DeFi leaders are up double digits over the past month. Bitcoin is soft, at $83,494 and down 3.14% on the week, so today’s pullback in AAVE and LINK is happening in a quiet market rather than a sell-off.
How the altFINS Analysts Read the AAVE Breakout
The altFINS curated setup for AAVE is still an active Resistance Breakout. Price broke above $162, which signals that buyers absorbed the supply at that level; after a breakout, the next resistance zone becomes the target. MACD turned bullish 27 days ago, and RSI is now neither overbought nor oversold.
📊 AAVE Breakout Levels (altFINS analyst setup)
- Breakout level being retested: $162
- Targets: $180 (PT1), then $200 (PT2)
- Invalidation: analyst stop at $143, just below the recent swing low
- Support zones: $145, then $125
- RSI14: 63.7, cooled off from overbought
Breakout Math: Why the Retest Changes Everything
Yesterday at the top, the trade looked great and the math was terrible. Near $174, the $180 target was only a few percent away, while the $143 stop was nearly 18% below. Today, from $160.54:
- Reward to PT1 ($180): +12.1%
- Reward to PT2 ($200): +24.6%
- Risk to the stop ($143): −10.9%
That’s about 2.25-to-1 on the second target, from the same chart a day later. Broken resistance tends to act as support, and breakouts often come back to test it. The retest is where the risk/reward improves.
The rule works for any coin. Before you buy a breakout, measure the distance to the target and to the stop. If the stop is farther away than the target, wait for the retest, and then wait for the retest to hold.
Which DeFi Coins Still Have Room?
A Strong Up trend tells you direction, not timing. RSI14 and the nearest levels show how stretched each coin is. These are levels to watch, not signals to act on.
MORPHO, RSI 53.3: The least stretched name in the table, but also flat on the week at −1.53%. Resistance is at $2.98.
UNI, RSI 58.7: Up 88.62% over the past month but down 13.63% this week. It’s cooling off well above its 50-day average of $6.21.
LINK, RSI 62.1: Down 6.20% today after Tuesday’s pop. It’s still above last week’s $13.30 breakout level.
AAVE, RSI 63.7: Sitting right on the $162 retest. See the levels box above.
SKY, RSI 66.4: Up 17.75% this week and just under resistance at $0.0858, with $0.0901 next.
ENA, RSI 69.4: Up 4.11% today and 20.61% this week. It’s the most stretched of the group, just under overbought.
Aave (AAVE) Price Prediction: Technical Chart Analysis
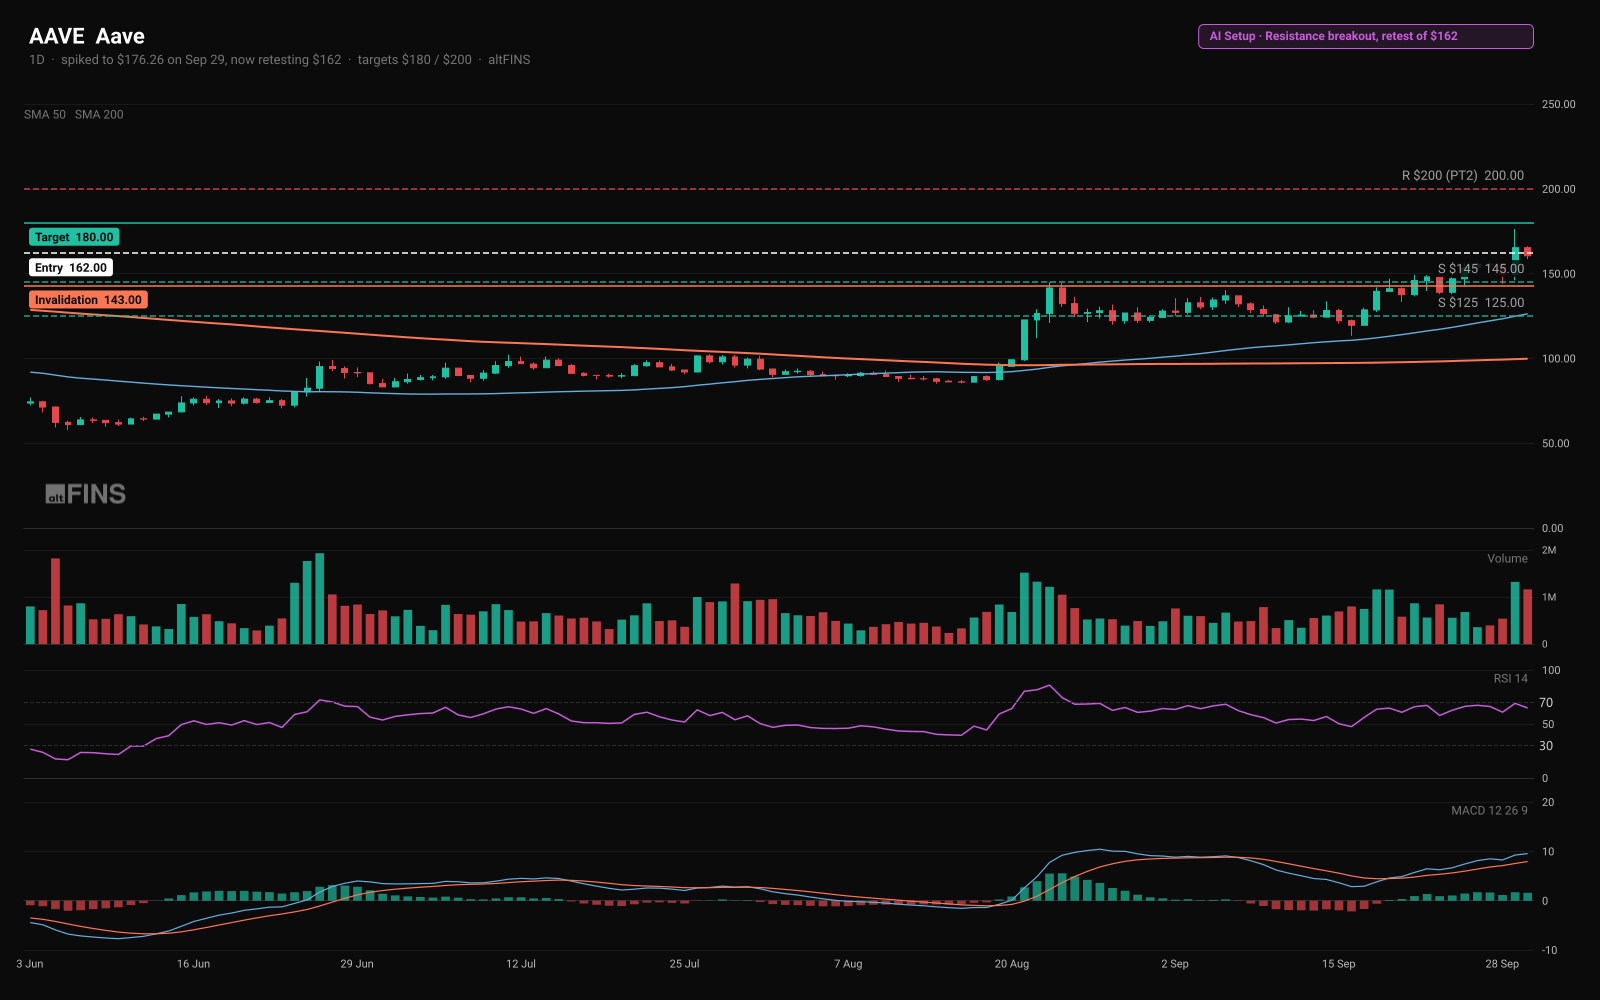
Before Tuesday’s breakout candle, AAVE was capped below $158 all of last week, topping out at $157.40 on September 27. Price is still 60.8% above its 200-day moving average ($99.81), and the 50-day ($126.31) is rising. Three scenarios frame the next move:
- Closes back above $162: the retest holds and old resistance becomes support. The $180 and $200 targets stay in play, with the September 29 high of $176.26 as the first hurdle.
- Chops between $145 and $162: the breakout stalls without failing. Patience; the $145 support zone is the line to watch.
- Closes below $143: the breakout has failed and the analyst stop is hit. The $125 support zone is next.
📌 Key Takeaways
- AAVE spiked to $176.26 on September 29 after Aave V4 began accepting seven Coinbase tokenized US stocks as collateral for USDC loans.
- It is now back at $160.54, retesting the $162 breakout level, with all three trend scores still Strong Up and RSI at 63.7.
- From here the math is about 2.25-to-1: +24.6% to the $200 target against −10.9% to the $143 stop.
- A daily close back above $162 confirms the retest; a close below $143 invalidates the setup.
- Watch today’s US PCE print and the EU’s September 30 DeFi-lending deadline.
Frequently Asked Questions
Why did Aave (AAVE) price jump this week?
Aave V4 launched an Equities Hub on Base that accepts seven Coinbase tokenized US stocks (Apple, Amazon, Alphabet, Meta, Microsoft, Nvidia and Tesla) as collateral for USDC loans, with Chainlink supplying the price data. AAVE rose 10.6% on September 29, touching $176.26 intraday. On the altFINS screener it is still up 8.44% on the week and 26.64% on the month.
Is AAVE a buy after the pullback?
AAVE is back at $160.54, right at the $162 level it broke on September 29. From here, the $180 and $200 analyst targets are 12.1% and 24.6% away, and the $143 stop is 10.9% below. That is a much better balance than at the top, but the breakout only holds if AAVE closes back above $162. A daily close below $143 would invalidate the setup. This is education, not a recommendation.
What are the key AAVE support and resistance levels?
$162 is the pivot: the breakout level the altFINS analysts flagged, now being retested. Support zones sit at $145 and $125, with the analyst stop at $143. Resistance and targets are $180 and then $200, and the September 29 high was $176.26. The 50-day moving average is at $126.31 and the 200-day at $99.81.
Catch breakouts like AAVE’s the day they trigger, and track the retests that follow, with live support, resistance and trend scores for every coin on the altFINS screener.
👉 Open the Free Crypto Screener on altFINS →
Disclaimer: This article is for education and information only. It is not financial advice, not a recommendation to buy or sell any asset, and not a solicitation. Crypto is highly volatile and you can lose your entire capital. Always do your own research. altFINS and its team may hold positions in assets mentioned.
 Written byLenka Fetyko
0 Comments
Leave a comment