Technical analysis of BTC, ETH, XRP, BCH, LINK
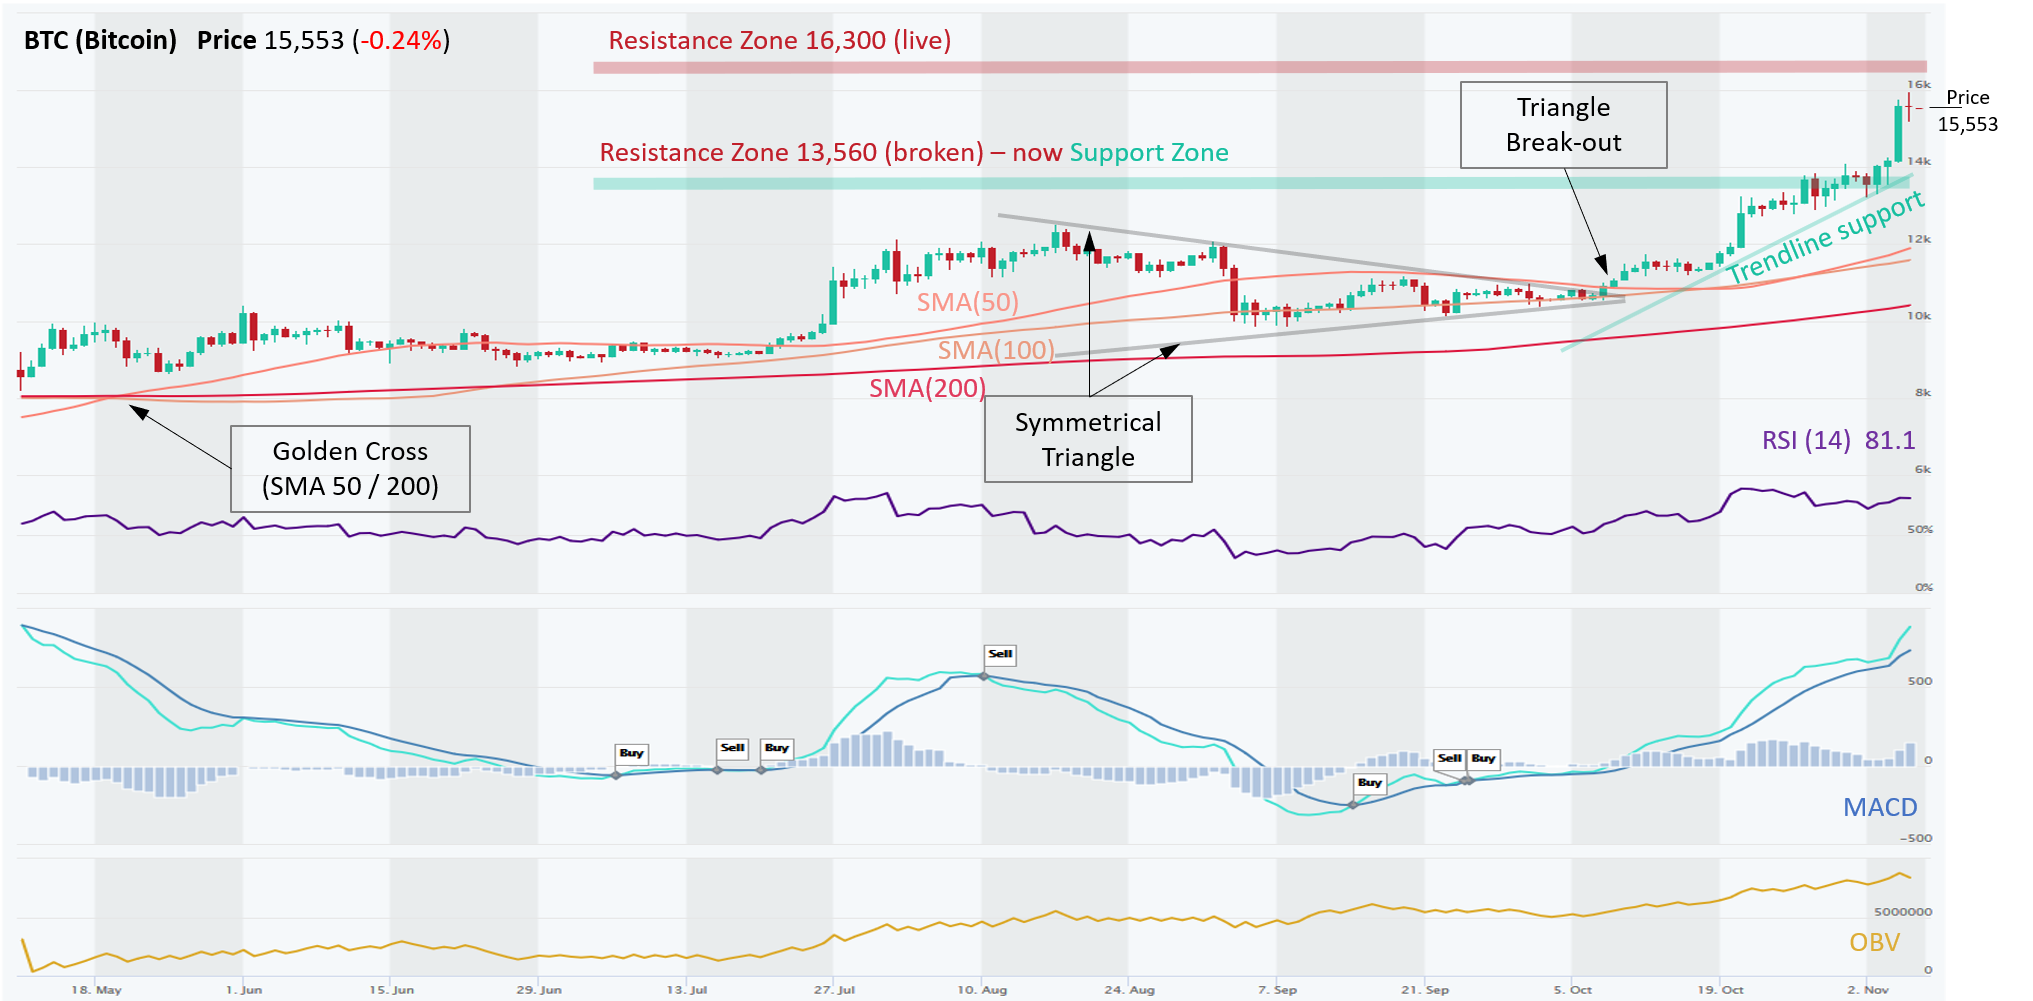
Bitcoin (BTC) is in a clear Uptrend across all time horizons (Short-, Medium-, and Long-Term). In early October, BTC broke upwards from a Symmetrical Triangle formation and marched strongly upwards ever since. BTC touched resistance at $13,560, which was the 61.8% Fibonacci retracement from the 2017 high, but after consolidating there for a couple of days, it broke this resistance with confidence and is marching towards another resistance at $16,300 which is the 78.6% retracement from the 2017 high. The prior Resistance Zone (~$13,500) has now turned into Support Zone, which is a critical TA principle known as Polarity. There is also a Trendline Support around $14,000.
It seems like there is no stopping Bitcoin, but RSI entered overbought levels again (>70) and it is interesting to note that although BTC price produced another high, the RSI indicator failed to produce new high and is trending a bit downwards, which may be an indication of bearish divergence.
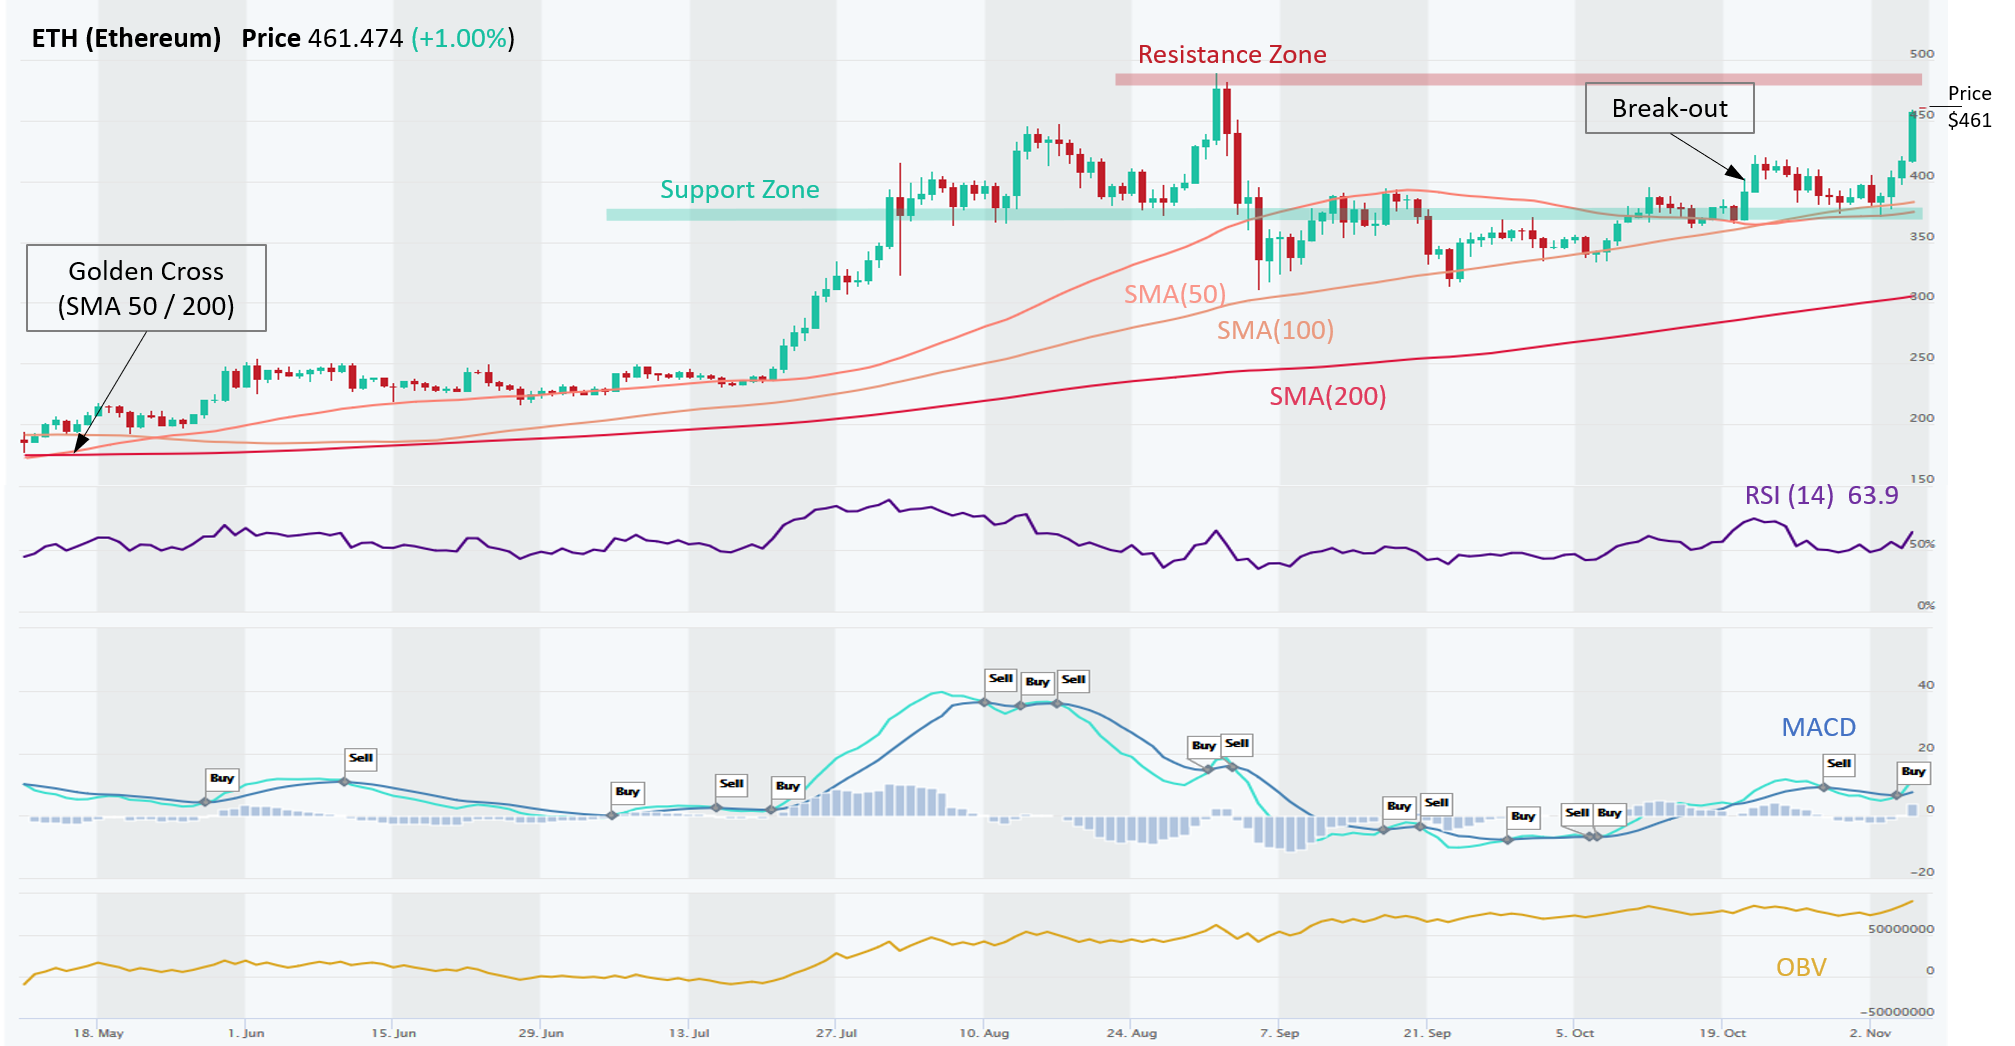
Ethereum (ETH) is in an Uptrend across all time horizons (Short-, Medium-, and Long-Term). Since September, ETH was struggling with a Resistance Zone around $375, which it finally broke on Oct 21. Now that Resistance Zone has become a strong Support Zone, in a TA principal known as Polarity. Following the breakout on Oct 21, the price retreated to that Support Zone and bounced hard. The next Resistance Zone is around $490, which is this year’s high. MACD is indicating bullish momentum and RSI is still not overbought (< 70). OBV is also making new highs, meaning that volume on Up days has exceeded volume on Down days, reflecting on the bullish demand / supply picture.
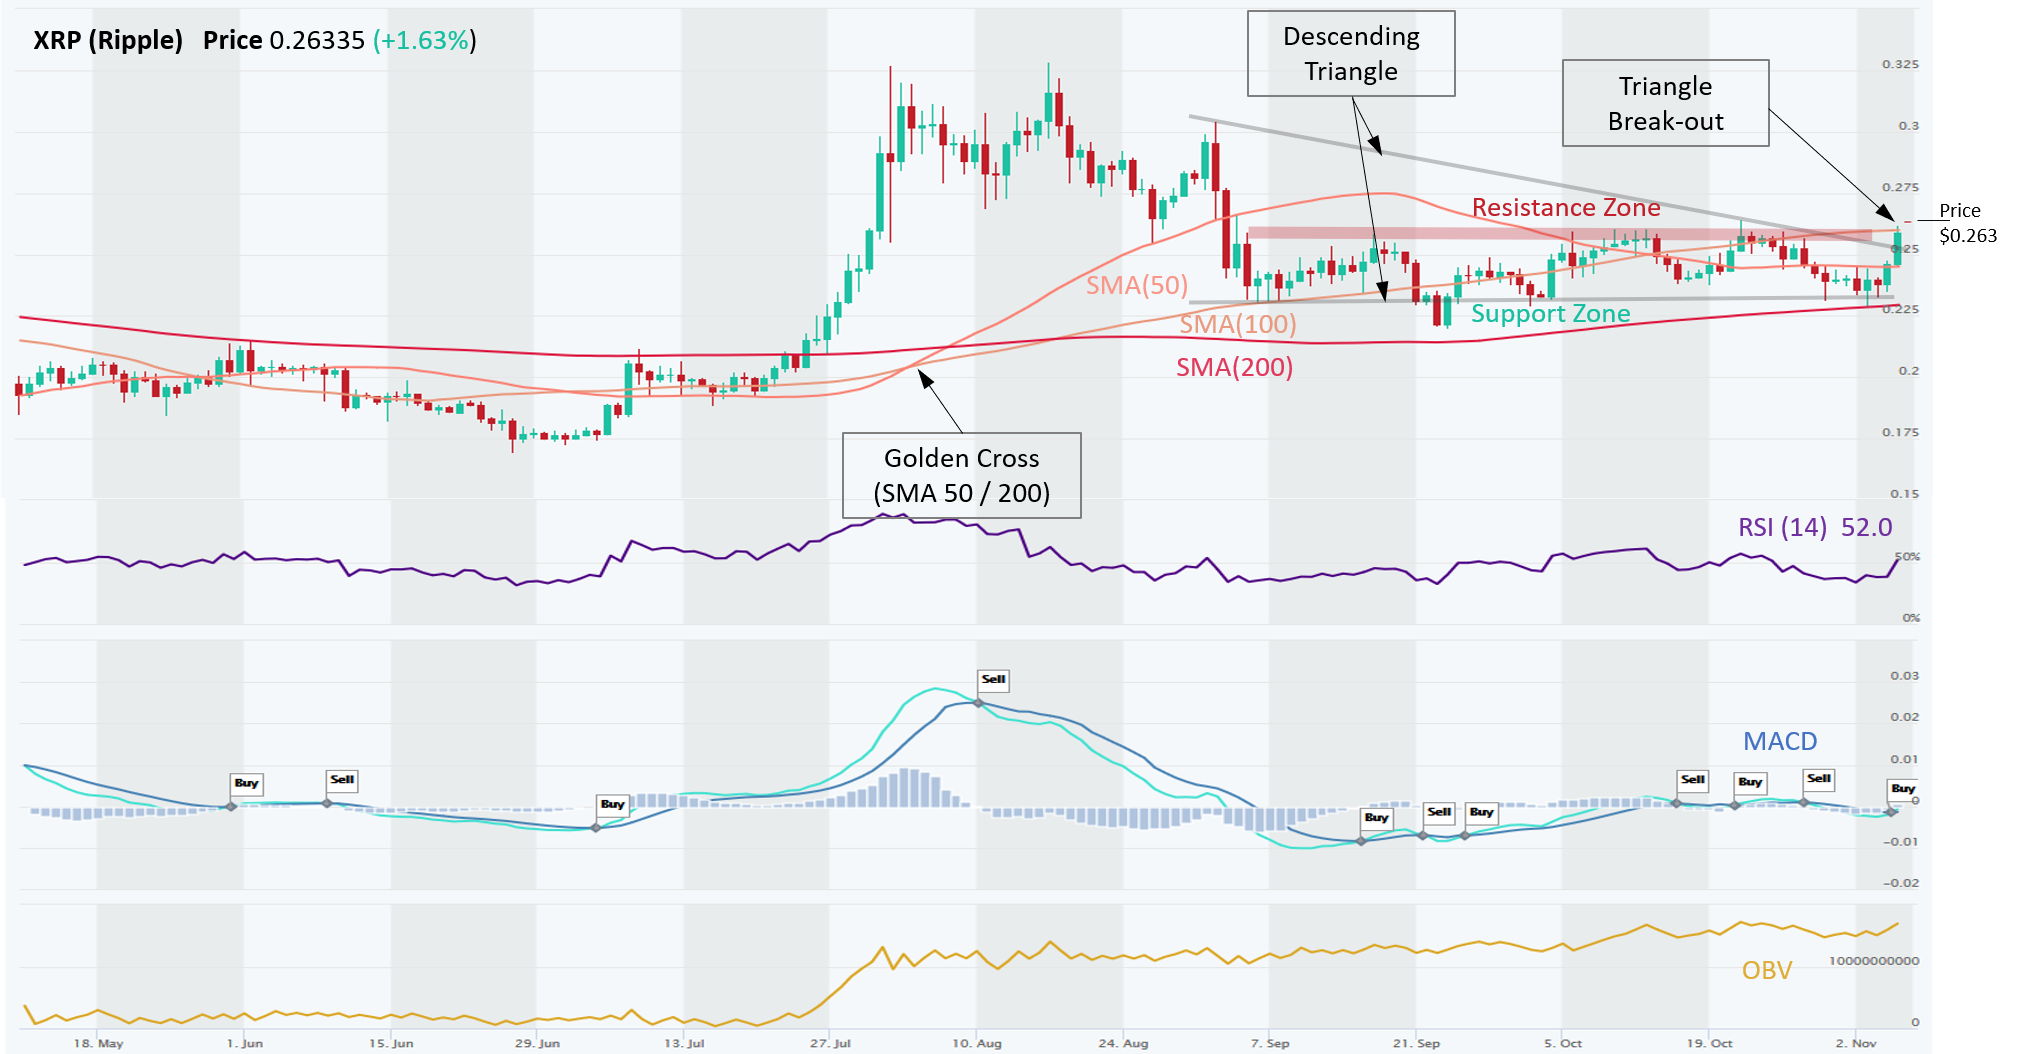
Ripple (XRP) is in Long-Term Uptrend, Medium-Term Downtrend, while Short-Term trend is Neutral. XRP is very interesting, because it broke upwards from a Descending Triangle, which started to form in late August and became more apparent in mid-October. It is at critical junction now, having reached a strong Resistance Zone (~ $0.26), which coincides with a SMA(50), which also acts as resistance. If it breaks out, the next resistance is around $0.30. If not, it’s likely to go back to its Support Zone (~ $0.225). MACD posted a bullish signal on Nov 5, which along with RSI above 50 confirms bullish short-term momentum. OBV is also making new highs, meaning that volume on Up days has exceeded volume on Down days, reflecting on the bullish demand / supply picture.
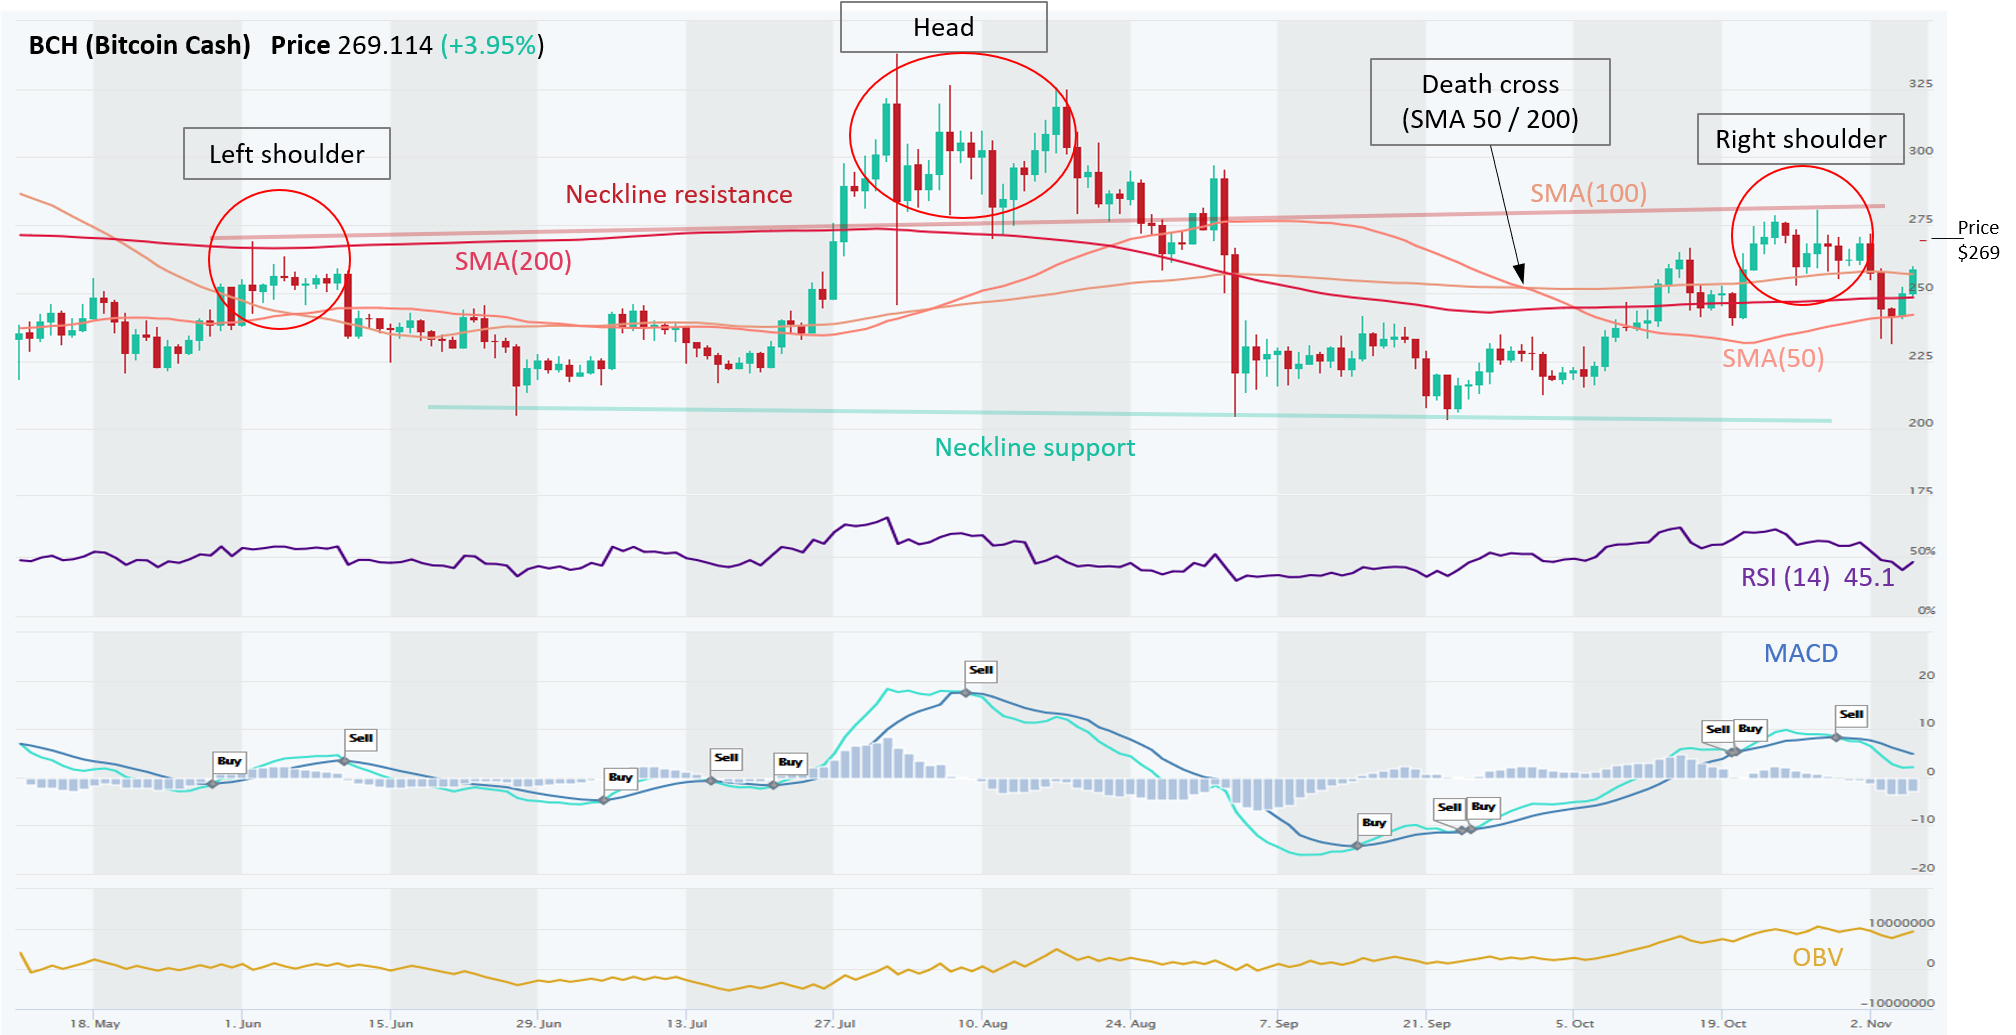
Bitcoin Cash (BCH) has uncertain Long-Term trend (Neutral), Medium-Term remains in a strong Uptrend, and Short-Term is in a Downtrend. Traders should be wary of an Emerging Head & Shoulders pattern, which started to form in May this year. There is a high probability that price reaches neckline support of the Emerging Head & Shoulders pattern, which in this case means price movement from ~255USD to ~200USD. Adding to the negative prognosis is a Death Cross from Oct 6 and also MACD sell signal, which flashed on Oct 31. RSI indicator is also trending downwards and is below 50, which is indicative of weakening momentum. On the positive side, OBV has been trending up, diverging from price direction.
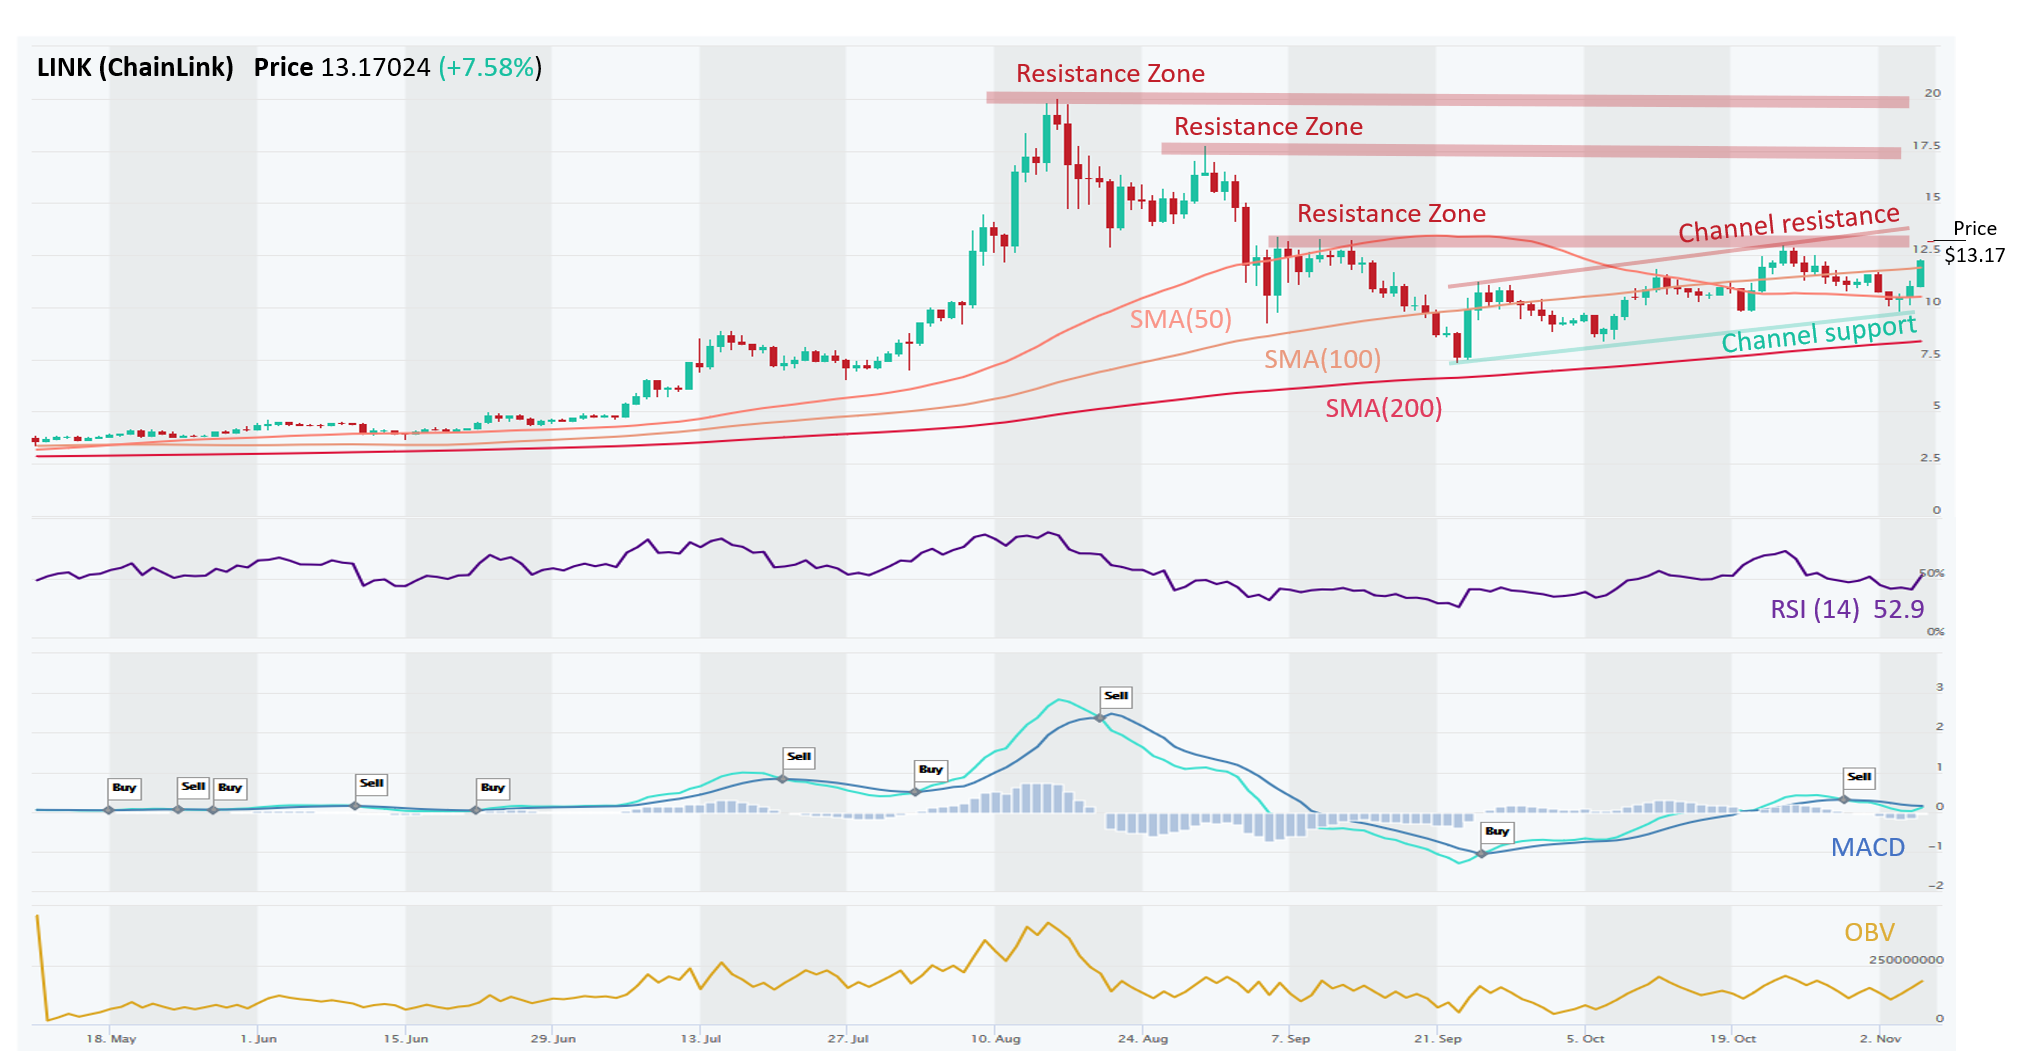
ChainLink (LINK) is in Long-Term, Medium-Term Uptrend, while the Short-Term picture is improving. After a 60% correction in September, there is renewed strength since October and LINK is trading in an Up Channel and it is respecting its boundaries quite well. It is now again sitting at the Resistance Zone and the Channel Resistance Trendline, which it was unable to break since early September, but if it does, the next stop would likely be $17.50. Traders could wait for the breakout, or wait for another pullback to its Channel Support Trendline to go long. While momentum fizzled a week ago (MACD Sell indicator) when the price pulled back in its Up Channel, it appears momentum is likely to swing back to bullish soon. Similarly, RSI crossed over 50 recently, indicating renewed bullish momentum.
Risk management – Stop Loss and trade size. In all of these setups, traders should use Stop Loss orders to manage their downside risk, in case the trade goes against us, as it often will. Trading is about probabilities and even though these setups have a high win rate, one must be prepared to minimize losses on the trades that go bust. If Stop Loss order types are not supported by they exchange, at least set up a price alert (see video). Also, trade size should be such that you never risk losing more than 2% of your total equity. Keeping the trade size small allows the trader to setup a wider Stop Loss, which gives the trade more room and time to complete with success. Setting Stop Loss levels too tight can often result in getting knocked out of a trade prematurely.
Disclaimer: This content is for informational purposes only, you should not construe any such information or other material as investment, financial, or other advice. There are risks associated with investing in cryptocurrencies. Loss of principal is possible.
