Crypto technical analysis of KSM, ABBC, REN, ZIL, ZRX
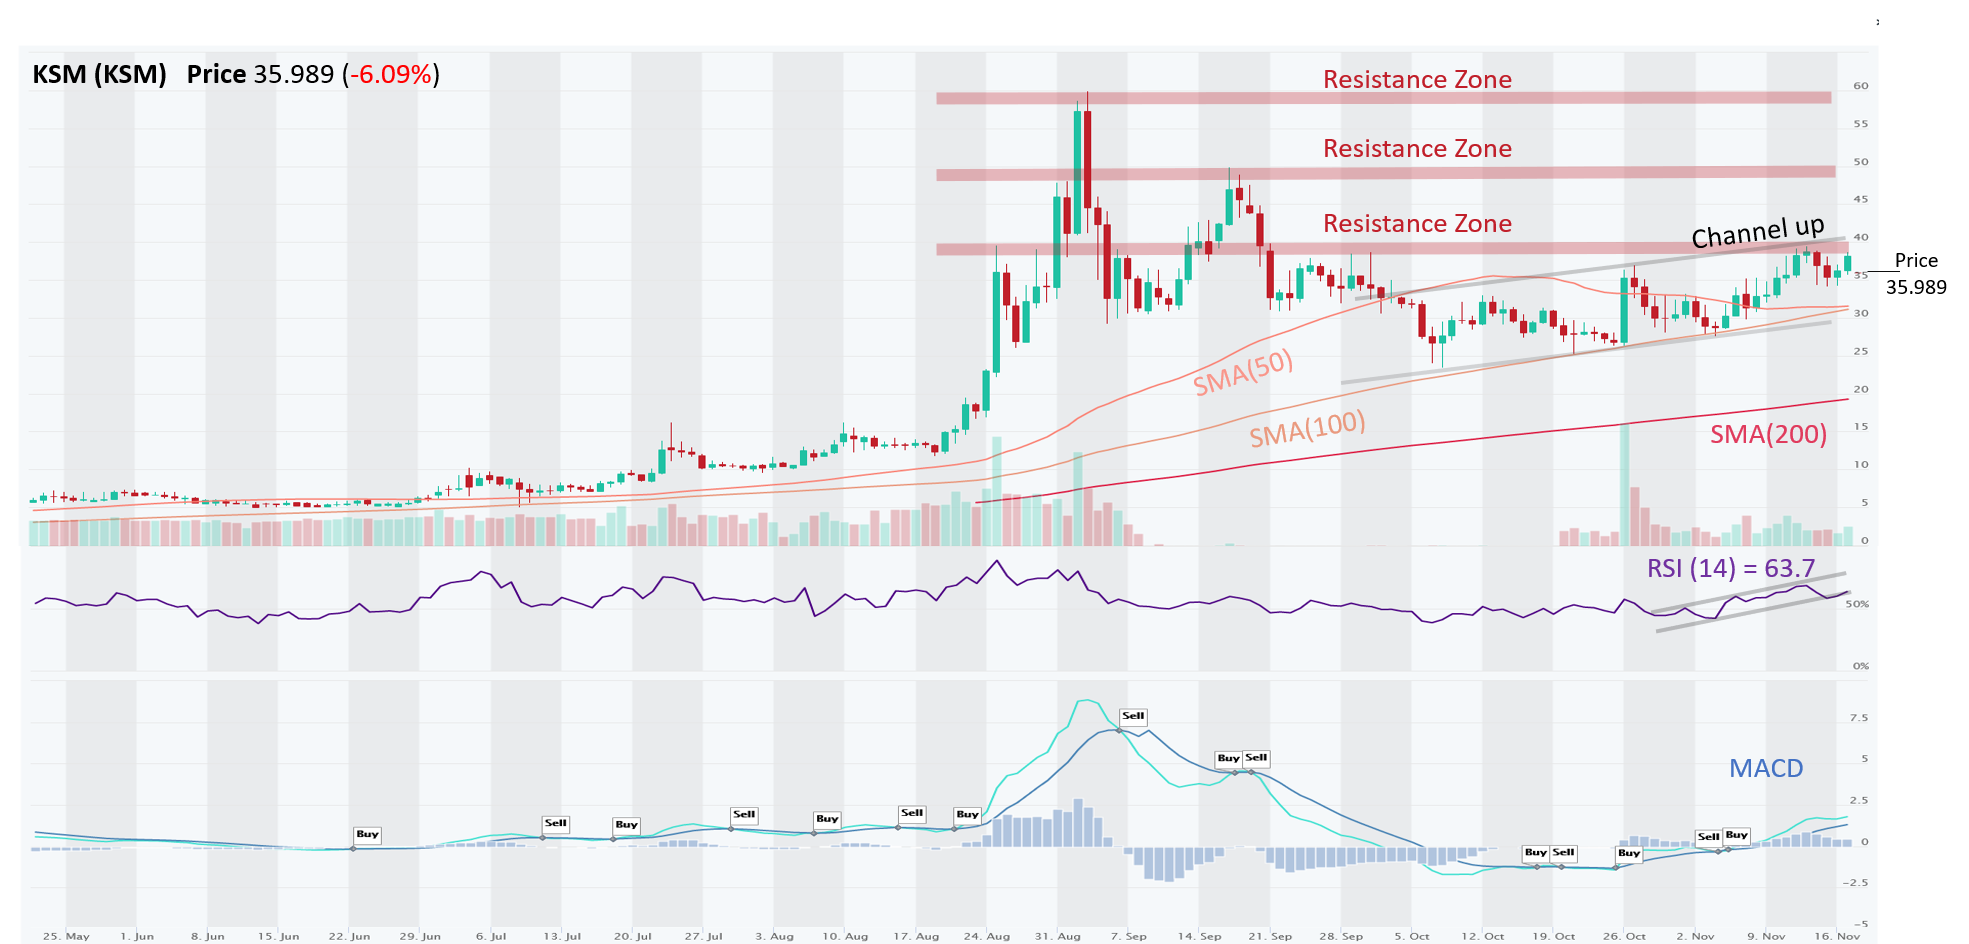
KSM – Promising Up Channel, 2x Paused By Resistance Zone; Is 3rd Try the Charm?
KSM (KSM) is in strong uptrend across all time horizons. Following a big runup in late August, the price consolidated during September and has formed an Up Channel since early October. Price trading above all major SMAs, giving it decent support levels. MACD produced a Buy signal on Nov-6 and RSI crossed above 50, indicating bullish momentum. ADX (trend strength) at 18.6 is indicating a rather weak Uptrend. The price got rejected a couple of times recently at a horizontal Resistance Zone around $40, but third time could be the charm, which would clear the way to the next Resistance Zone at $50.
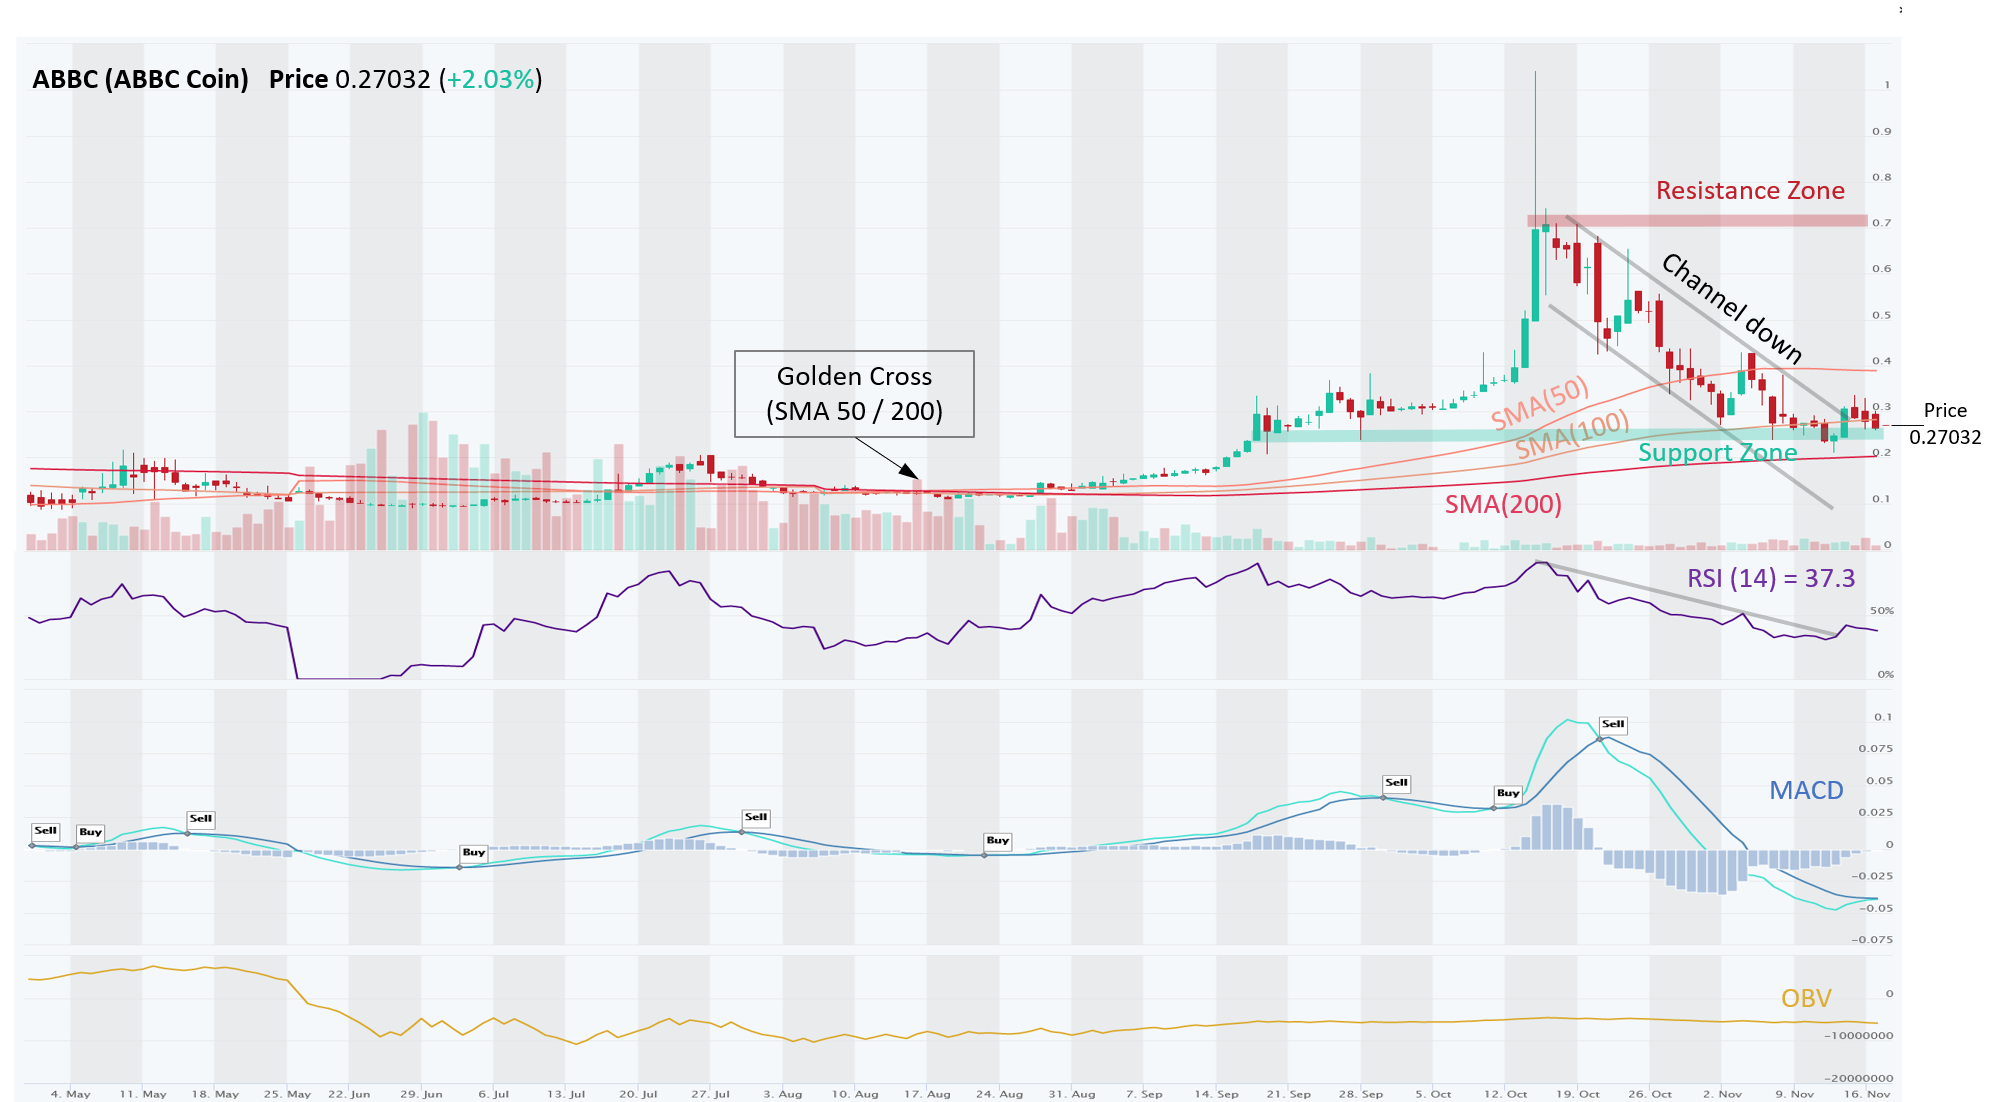
ABBC – Possible Bullish Breakout from a Down Channel
ABBC (ABBC Coin) is in a Long-Term Uptrend, while its Medium- and Short-Term trends are Down. Coin was trading in severe Down Channel, from which it recently broke upward, but needs further confirmation (price to stay above the Support Zone of $0.25). Momentum is improving from bearish to neutral, with RSI at 37.3 (oversold is 0-30), and MACD is very close to a bullish cross-over (traders should monitor this). OBV isn’t telling us much, and has been flat as volume on Up days has been about the same as on Down days. ADX (trend strength) is at 19, which indicates a weak trend, so the recent downtrend is weakening, which is positive.
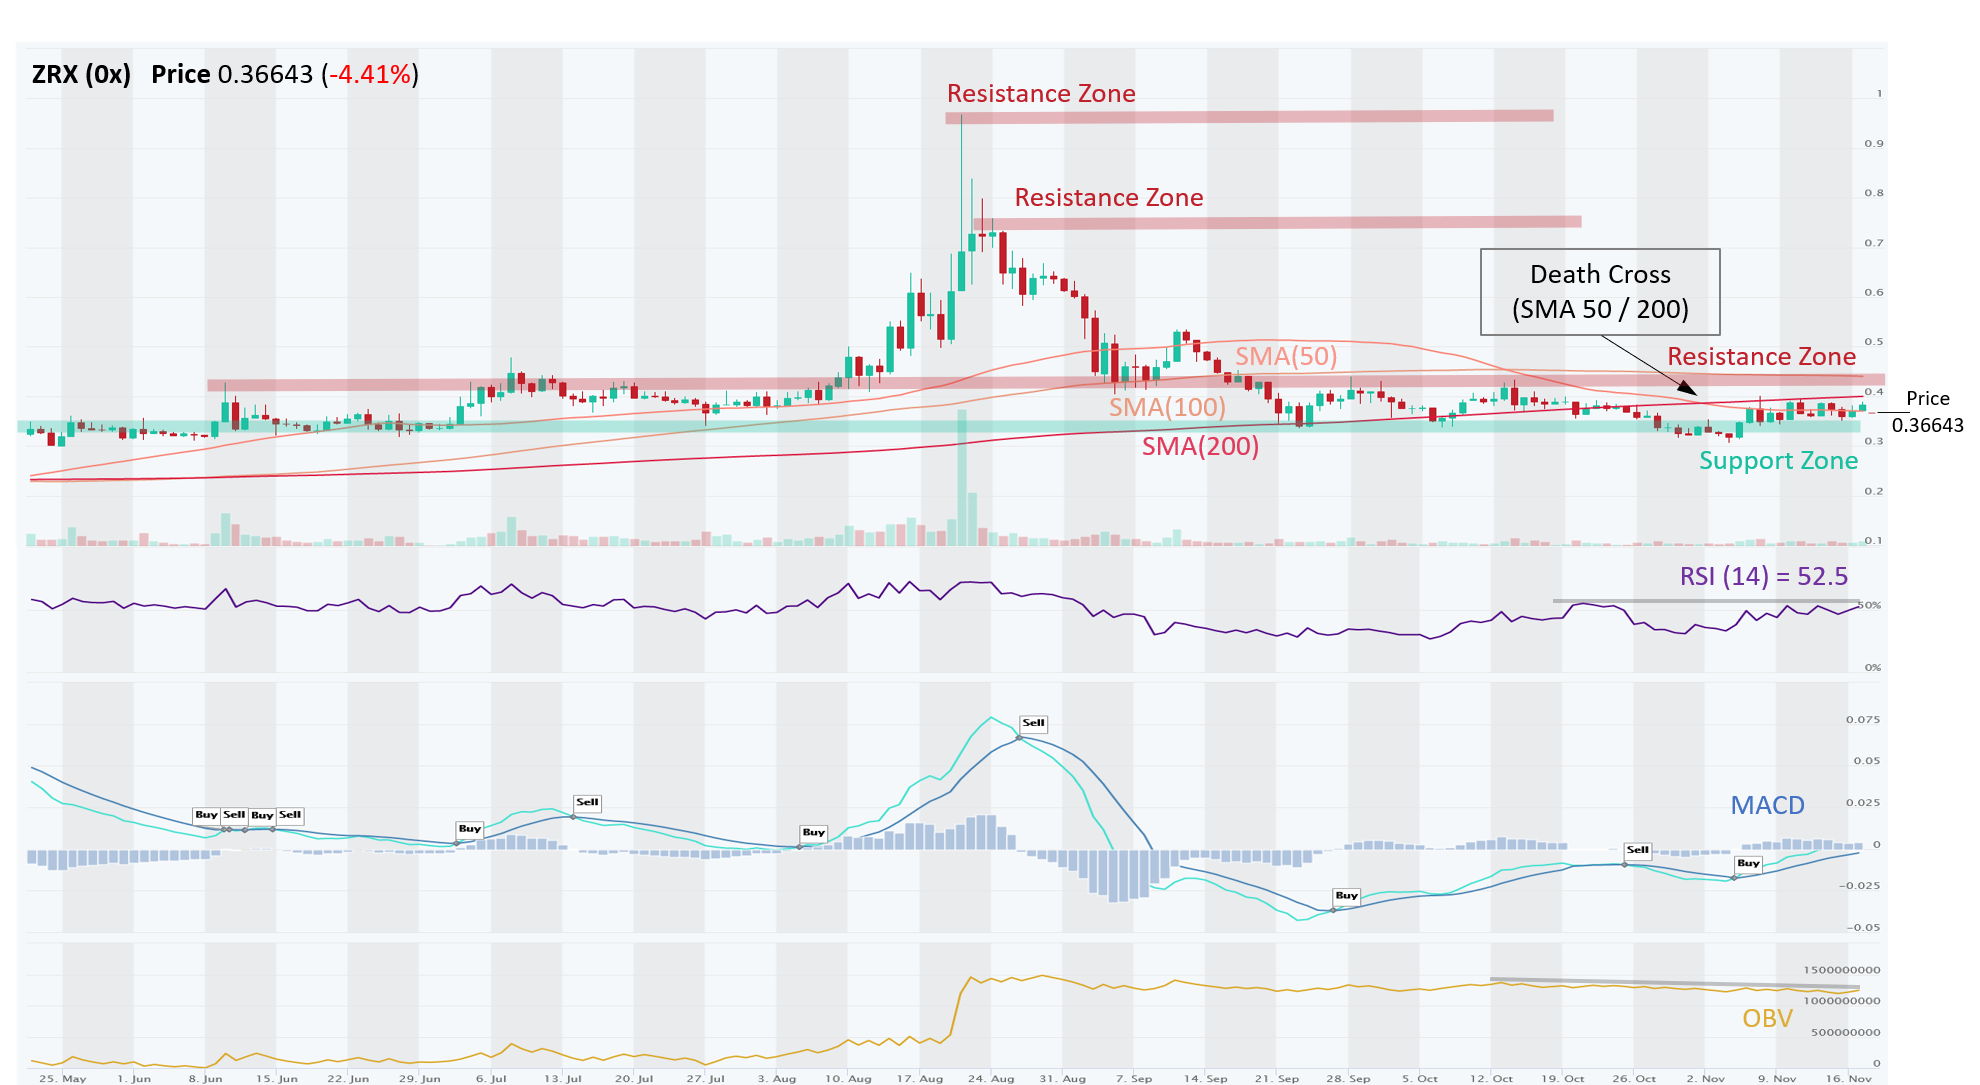
ZRX – Sideways Channel, Waiting For Breakout, Probably to the Downside
ZRX (0x) is in a Long-Term Uptrend, while its Medium- and Short-Term trends are Down. Price has been consolidating in a sideways Channel for two months now, flanked by a Resistance at $0.43 and Support around $0.35. Lately, it has spent more time around the Support and formed a Death Cross Nov-2 (bearish signal). Recently, bullish momentum picked up with MACD crossover (Buy signal) on Nov-5 and RSI above 50, but all of that with low volumes as indicated by OBV downtrend (volume on Up days is lower than on Down days), which does not instill confidence. ADX (trend strength) of 22.5 indicates a strong trend, but ADX itself is declining, which suggests that the current Downtrend is weakening. Weighing all the evidence, it seems there is a greater chance of breakout to the downside. Swing traders could trade the Channel (Buy Support, Sell Resistance) while trend following traders should just wait for a breakout (Up or Down).
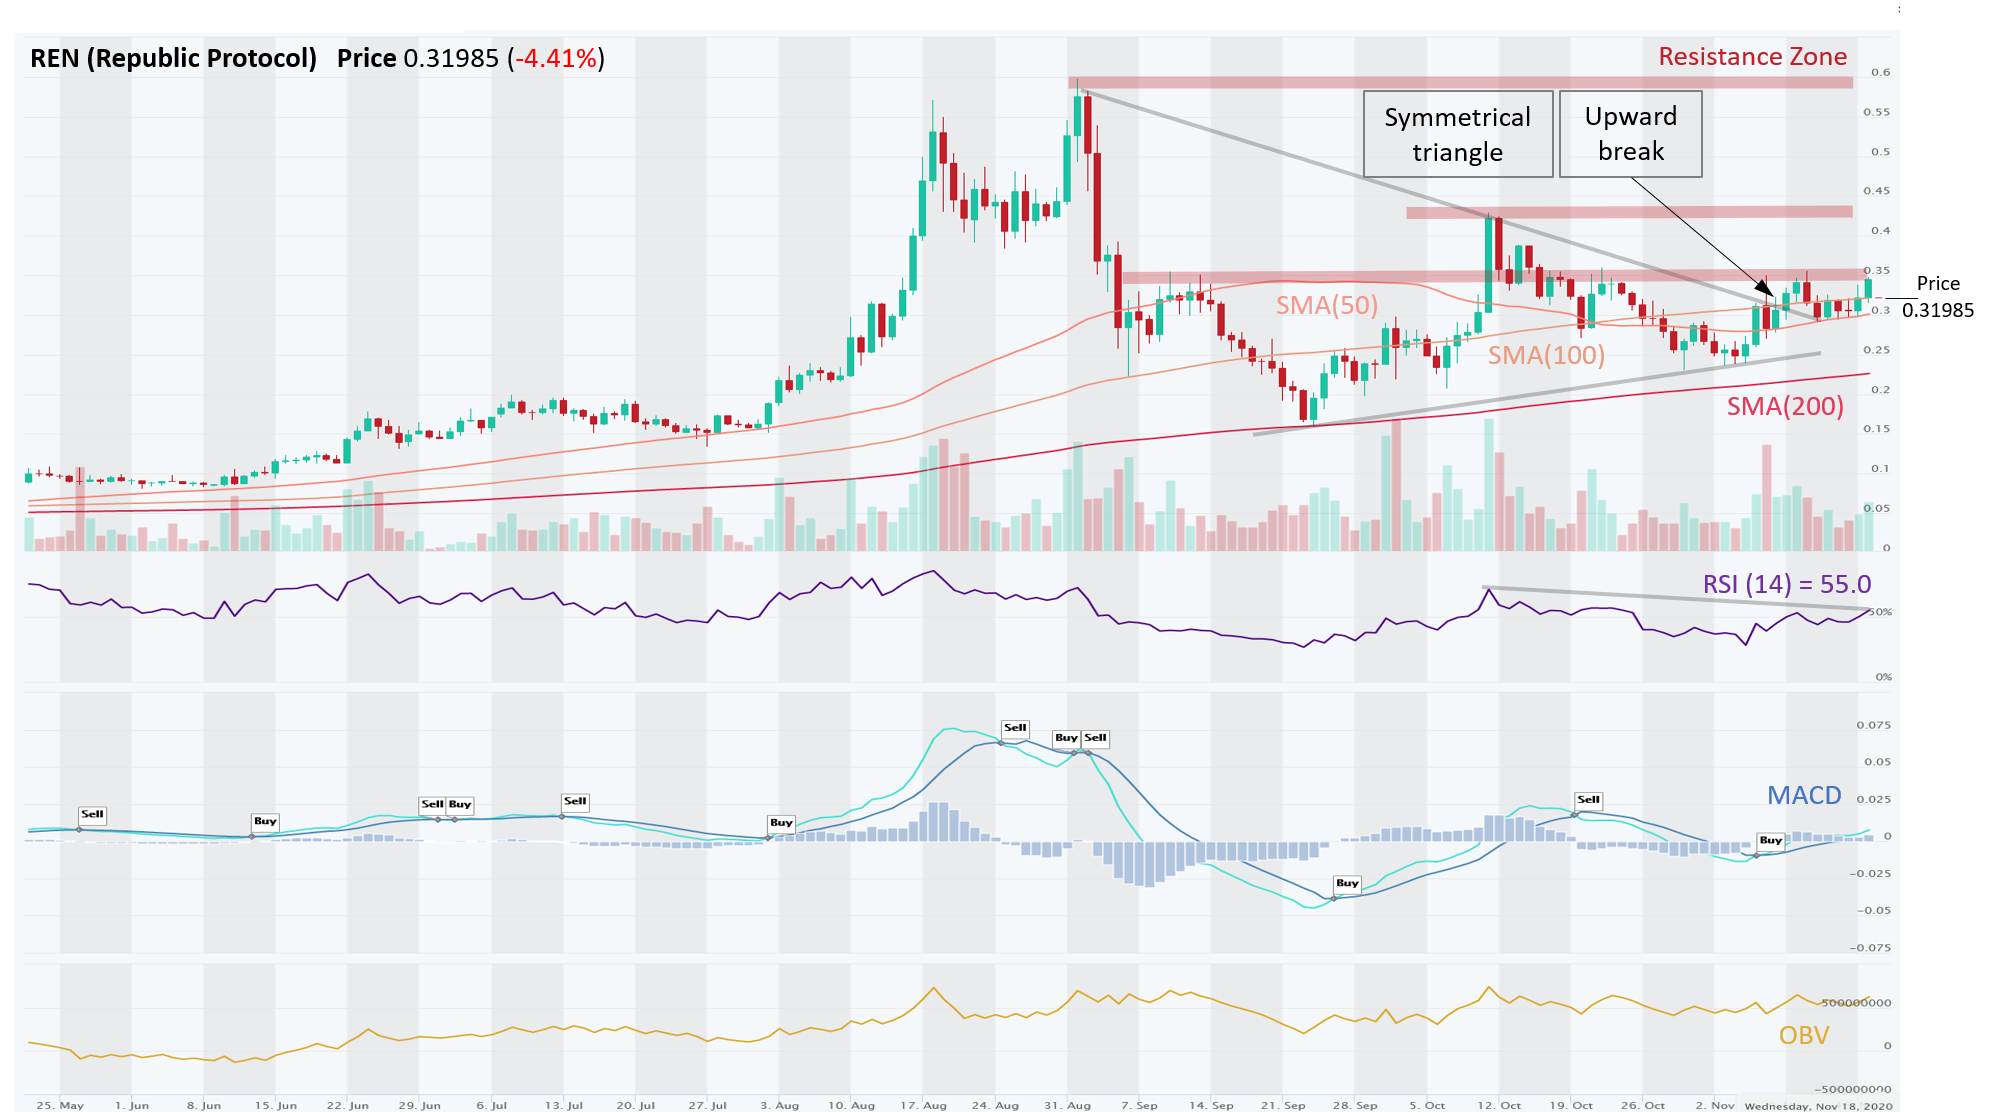
REN – Recent Triangle Breakout Stalled at a Resistance Zone But Momentum Could Carry it Through
REN’s (Republic Protocol) Long- and Medium-Term trends are Neutral, but Short-Term trend is Up. Recently, REN broke upwards from a symmetrical triangle (very bullish). Bulls have been pressing the price against a Resistance Zone around $0.35 a few times already, and it seems poised to break through. RSI is above 50 and rising again, which along with a bullish MACD crossover on Nov-6, suggests solid momentum building. Confirming the recent strength is rising OBV, indicating that buyers are in control (volume on Up days exceeded volume on Down days). If the price manages to break through the $0.35 resistance, the next stop would be 20% higher at $0.43.
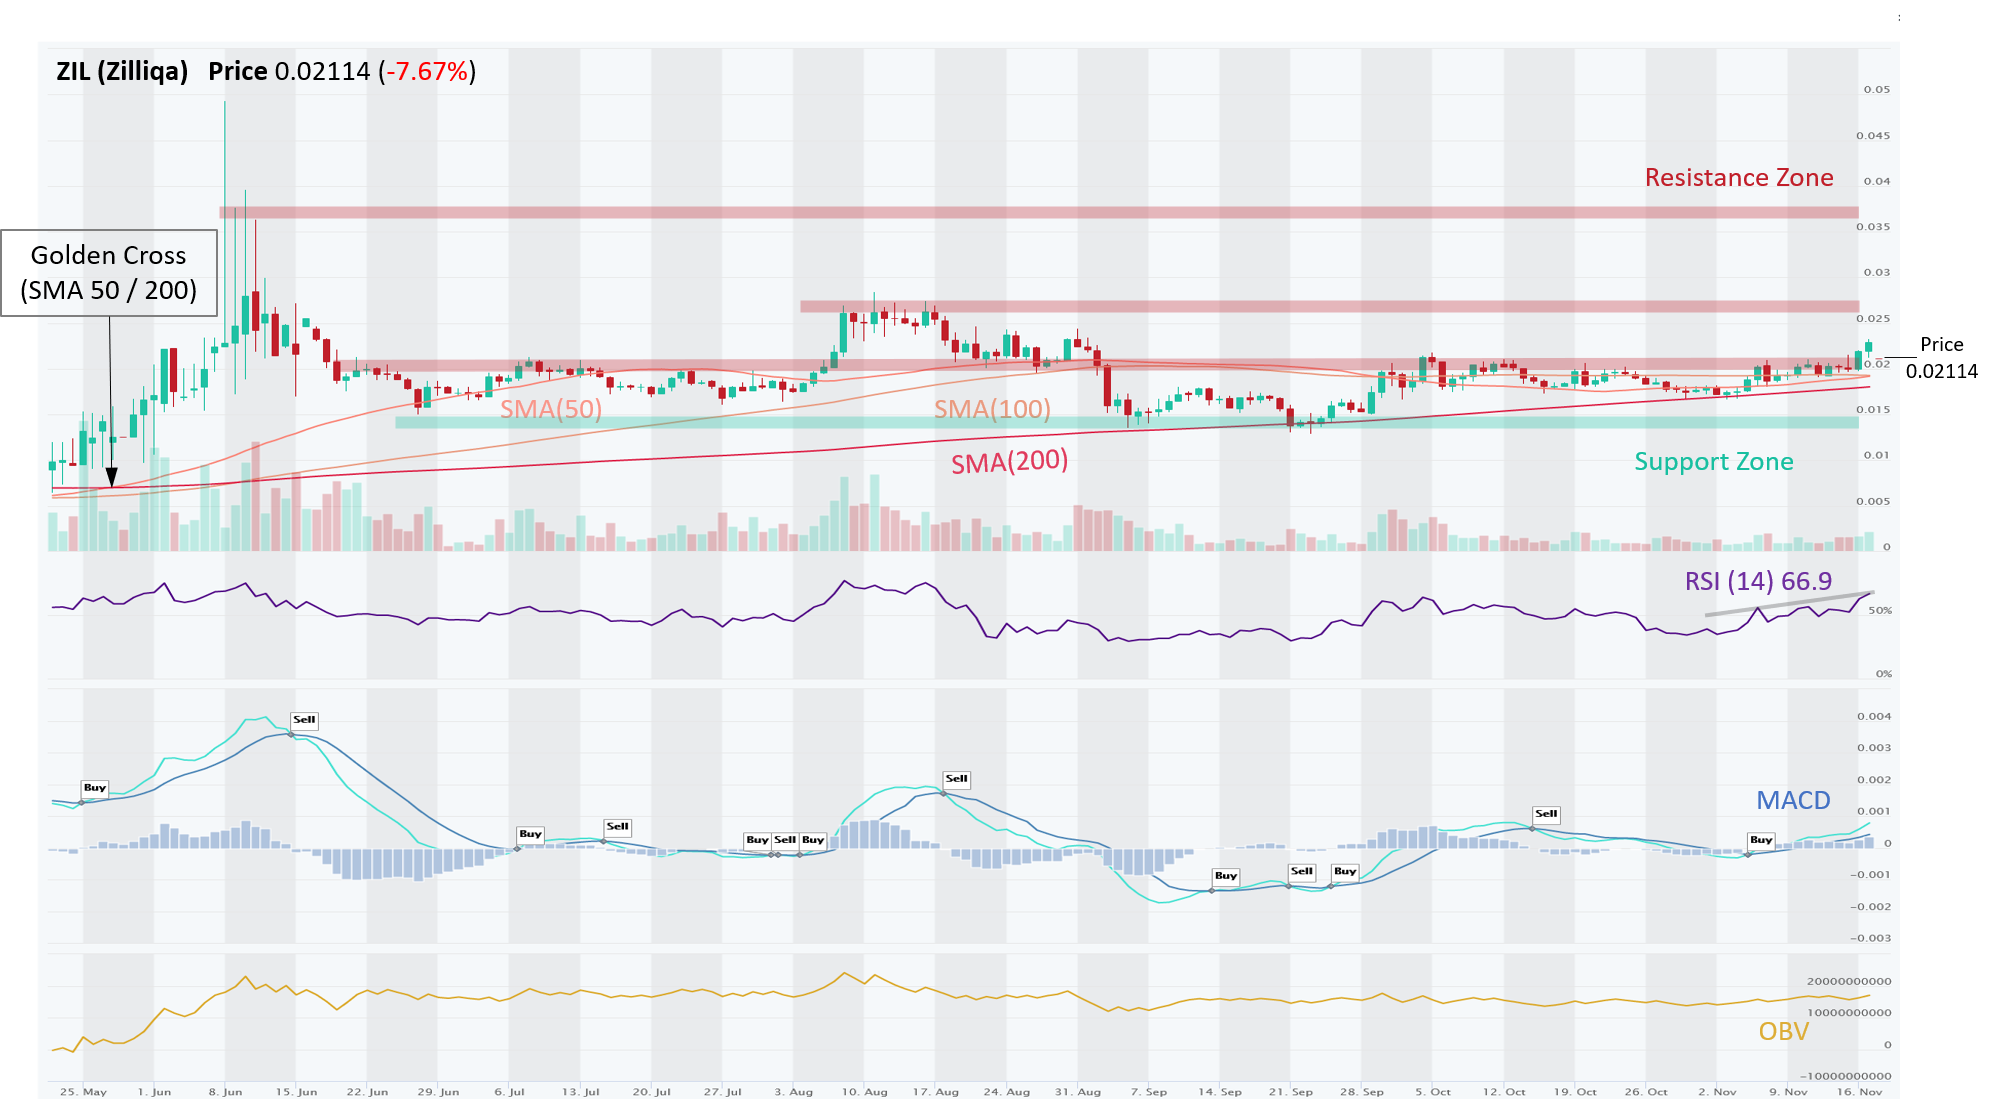
ZIL – Looks Like a Possible Breakout from a Long Sideways Channel
ZIL’s (Zilliqa) had been stuck in a sideways range for months, although the Short-Term trend is gradually turning Up. In fact, price has been pressing up against a formidable Resistance Zone at $0.020, which it finally cleared recently. If it sustains the momentum, the next Resistance is ~30% higher at $0.027. Providing Support is the 200-Day SMA which had already been respected a few times. Momentum indicators turned bullish (RSI at 66.9, MACD bullish crossover on Nov-6) and were confirmed by an uptick in OBV as well (volume on Up days exceeded volume on Down days). ADX (trend strength) is at 23, indicating strong trend, moreover, ADX is rising, which indicates that Uptrend is strengthening.
Risk management – Stop Loss and trade size. In all of these setups, traders should use Stop Loss orders to manage their downside risk, in case the trade goes against us, as it often will. Trading is about probabilities and even though these setups have a high win rate, one must be prepared to minimize losses on the trades that go bust. If Stop Loss order types are not supported by they exchange, at least set up a price alert (see video). Also, trade size should be such that you never risk losing more than 2% of your total equity. Keeping the trade size small allows the trader to setup a wider Stop Loss, which gives the trade more room and time to complete with success. Setting Stop Loss levels too tight can often result in getting knocked out of a trade prematurely.
Disclaimer: This content is for informational purposes only, you should not construe any such information or other material as investment, financial, or other advice. There are risks associated with investing in cryptocurrencies. Loss of principal is possible.